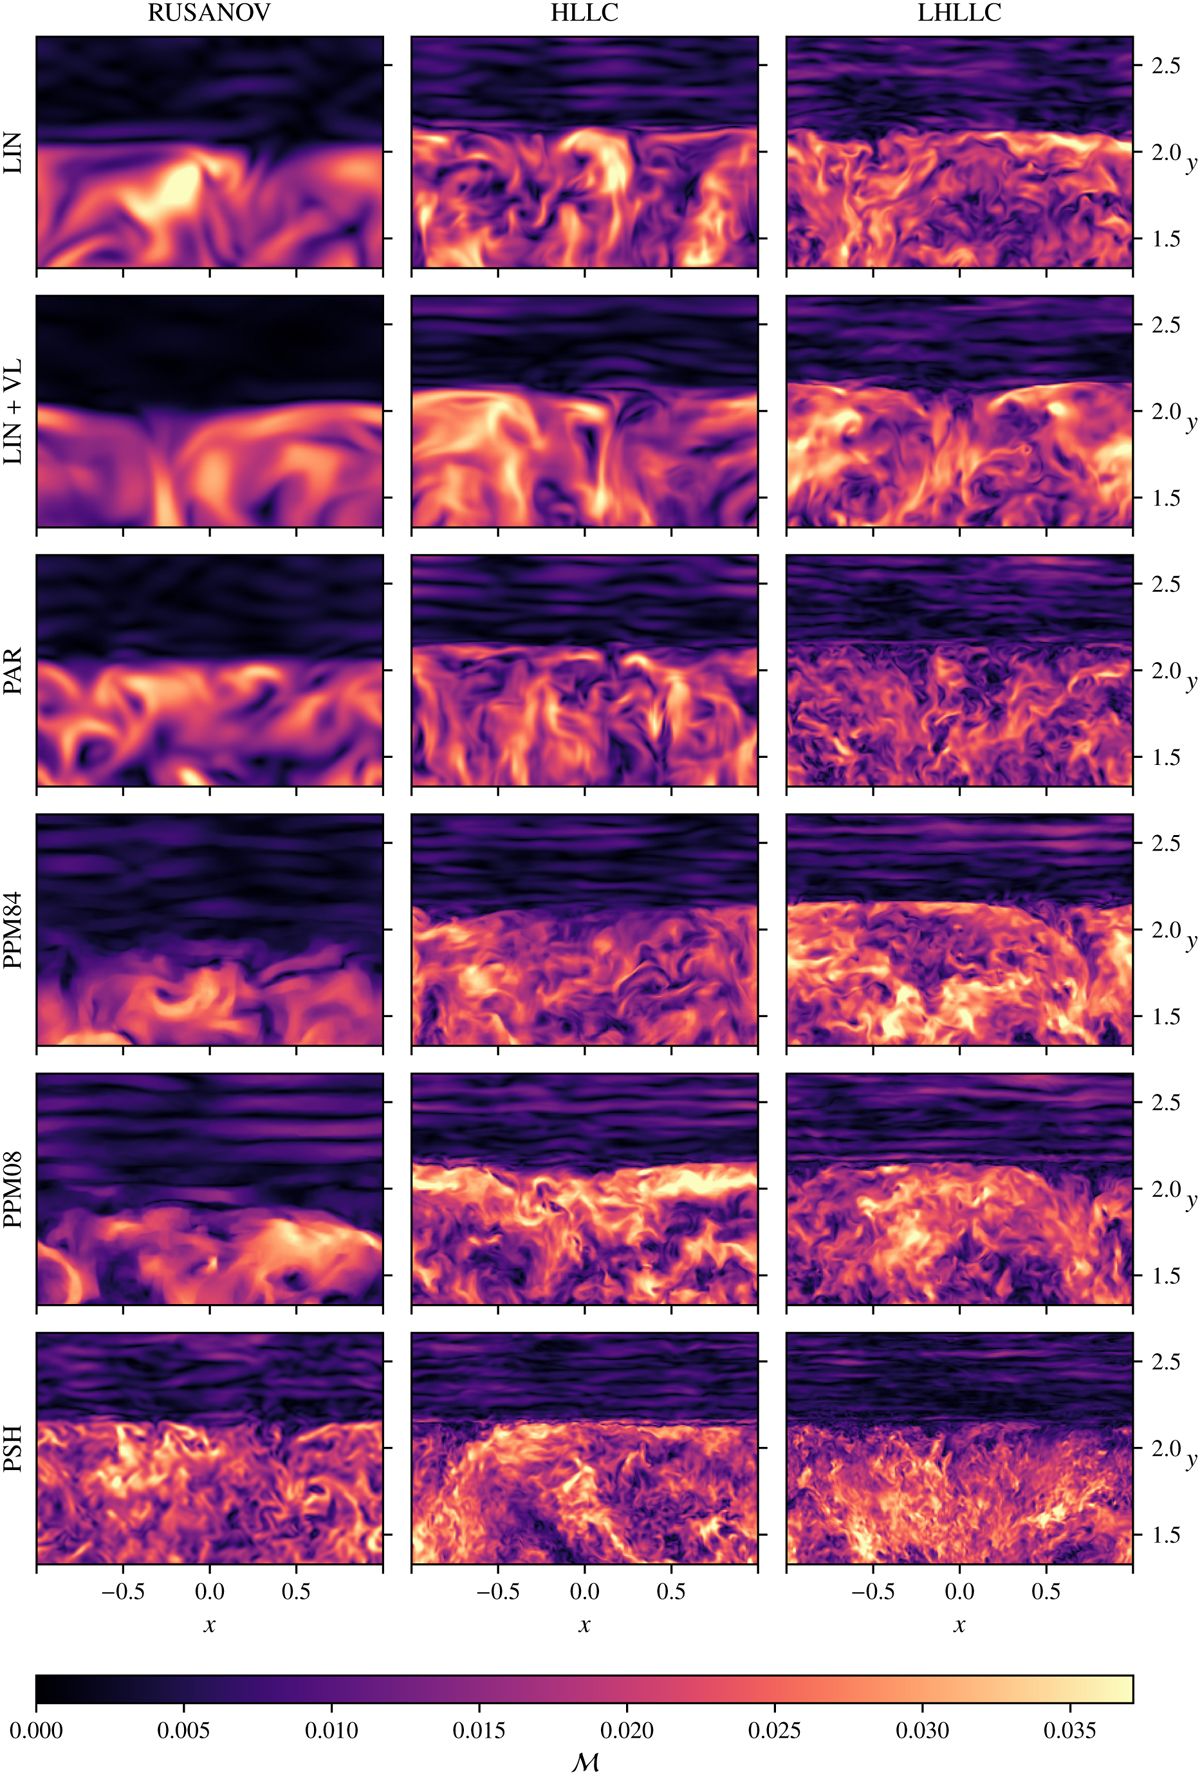
Fig. 9
Download original image
Snapshots obtained at the final simulation time (t = 32τconv) showing the distribution of the Mach number at z = 0 in the simulations of turbulent convection and wave propagation in a 3D box. The grid resolution is 2563. Each panel is cut between y = 1.3 and y = 2.7 for a better visualization of the flows in the proximity of the upper convective boundary.
Current usage metrics show cumulative count of Article Views (full-text article views including HTML views, PDF and ePub downloads, according to the available data) and Abstracts Views on Vision4Press platform.
Data correspond to usage on the plateform after 2015. The current usage metrics is available 48-96 hours after online publication and is updated daily on week days.
Initial download of the metrics may take a while.