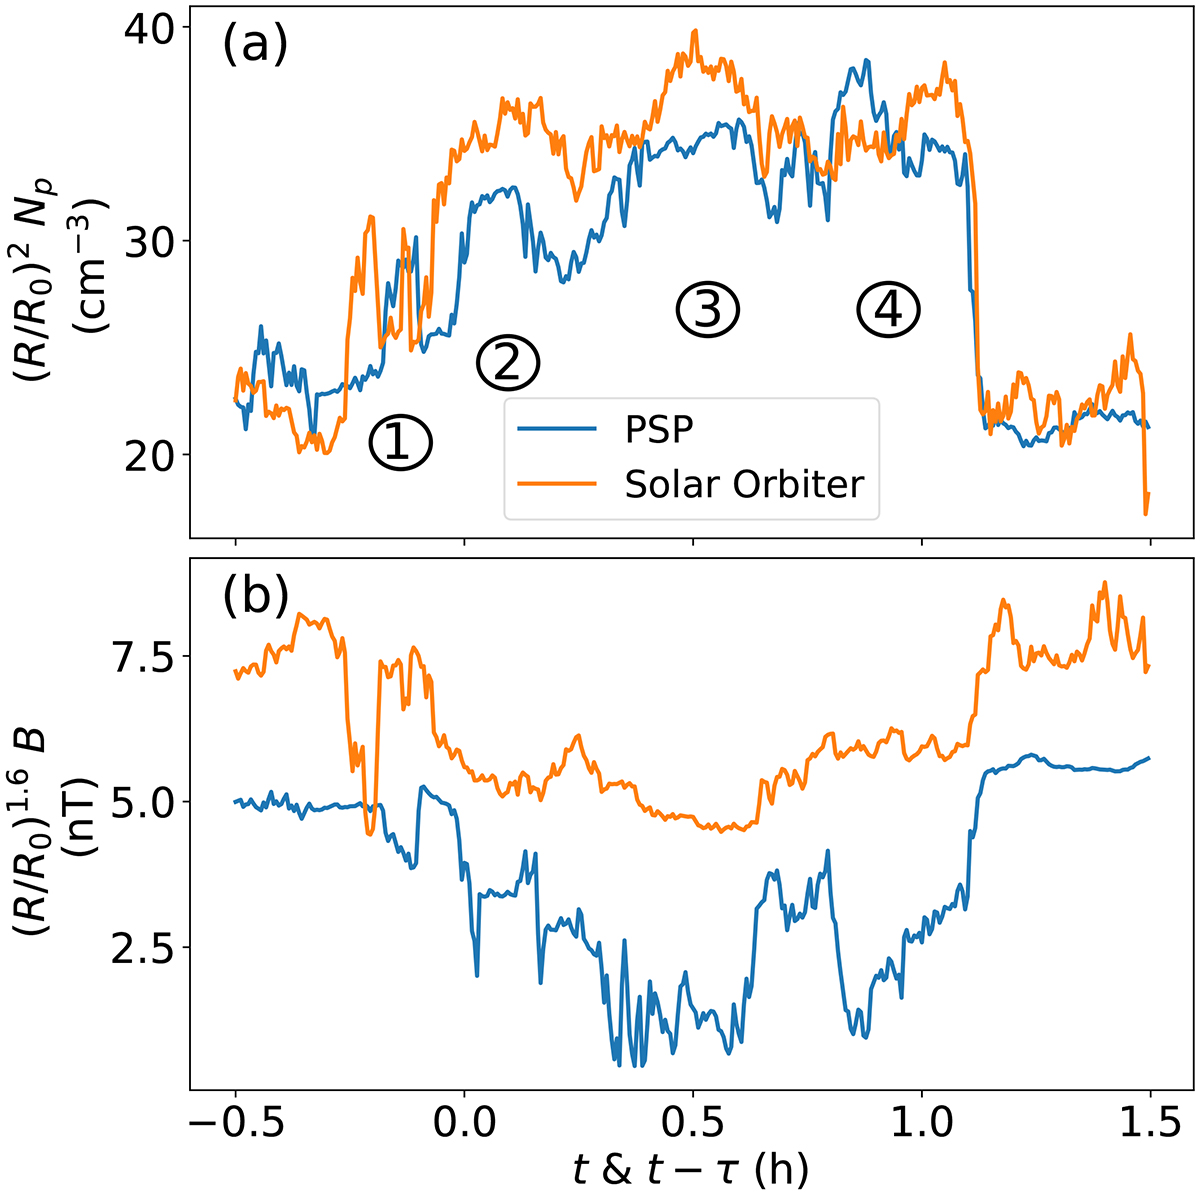
Fig. 8.
Download original image
Density structure measured by both PSP and Solar Orbiter. Proton density measurements (a) and magnetic field magnitude (b), corrected by a factor (R/R0)2 and (R/R0)1.6, respectively, to take the expansion from PSP (blue) to Solar Orbiter (orange) into account. The quantities are plotted as functions of t for PSP and as functions of t − τ for Solar Orbiter over a 2 h time interval (with τ = 137.6 h as determined by several cross-correlation methods; see Sect. 4.2). An average over 20 s was applied to the data to better highlight the global behavior of the density structures.
Current usage metrics show cumulative count of Article Views (full-text article views including HTML views, PDF and ePub downloads, according to the available data) and Abstracts Views on Vision4Press platform.
Data correspond to usage on the plateform after 2015. The current usage metrics is available 48-96 hours after online publication and is updated daily on week days.
Initial download of the metrics may take a while.