Fig. 1
Download original image
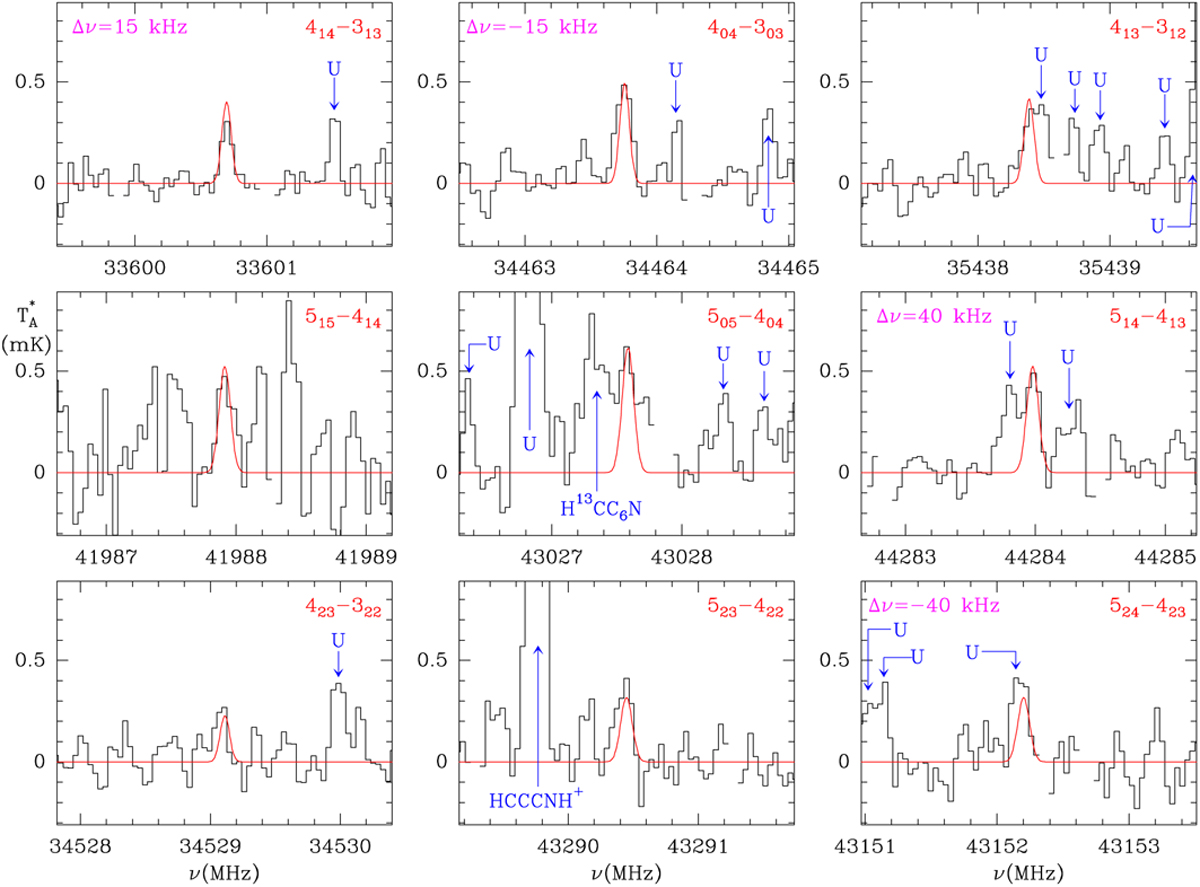
Observed lines of CH3CH2CCH in TMC-1. The line parameters are given in Table A.1. The abscissa corresponds to the rest frequency assuming a velocity for the source of 5.83 km s−1. The ordinate is the antenna temperature corrected for atmospheric and telescope losses in mK. Quantum numbers are indicated in the top right corner of each panel. The red line corresponds to the synthetic spectrum derived from the LTE model described in Sect. 3.1. Blanked channels correspond to negative features produced in the folding of the frequency-switching data. For some lines, we found a frequency shift of up to ±40 kHz with respect to the predictions (see Sect. 3.1). This is indicated in magenta in the corresponding panels.
Current usage metrics show cumulative count of Article Views (full-text article views including HTML views, PDF and ePub downloads, according to the available data) and Abstracts Views on Vision4Press platform.
Data correspond to usage on the plateform after 2015. The current usage metrics is available 48-96 hours after online publication and is updated daily on week days.
Initial download of the metrics may take a while.