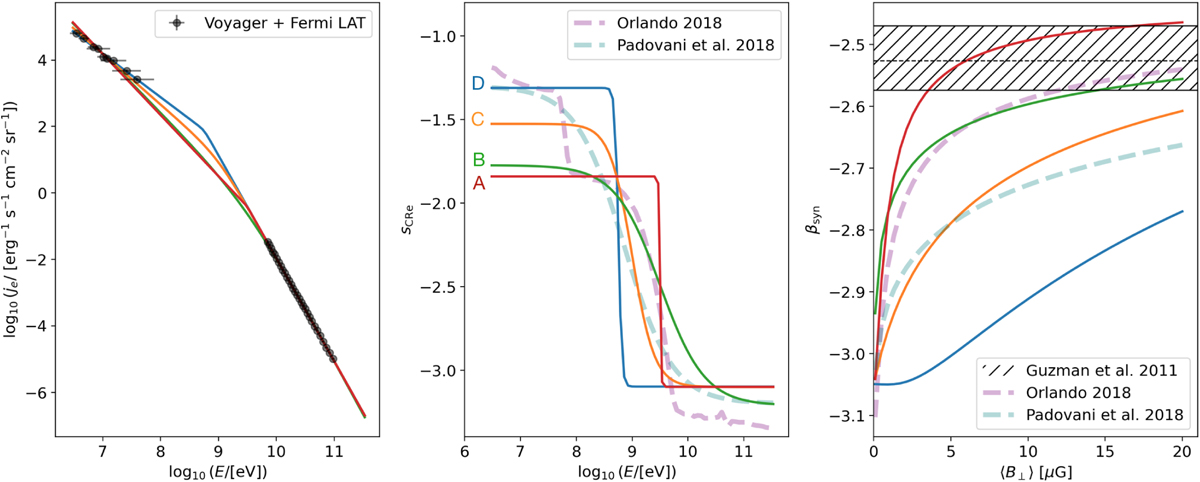
Fig. 2
Download original image
Our models for sCRe obtained with Eq. (3) and their impact on the modeled synchrotron spectral index βsyn. Colors correspond to the same models in all panels. Left panel: je from models A, B, C, and D with parameters listed in Table 1 that fit the black data points from Voyager (E < 108 eV, Cummings et al. 2016; Stone et al. 2019) and Fermi-LAT (E > 1010 eV, Ackermann et al. 2010). Central panel: sCRe values corresponding to the same models as in the left panel. Right panel: values of βsyn for the same models as in the other panels with the observed spectral indices from G 11 in hatches – the 16th, 50th, and 84th percentiles are marked as in Fig. 1. Models for sCRe and βsyn using je from Orlando (2018) and Padovani et al. (2018) are also shown in dashed purple and teal lines in the central and right panels, respectively.
Current usage metrics show cumulative count of Article Views (full-text article views including HTML views, PDF and ePub downloads, according to the available data) and Abstracts Views on Vision4Press platform.
Data correspond to usage on the plateform after 2015. The current usage metrics is available 48-96 hours after online publication and is updated daily on week days.
Initial download of the metrics may take a while.