Fig. 3
Download original image
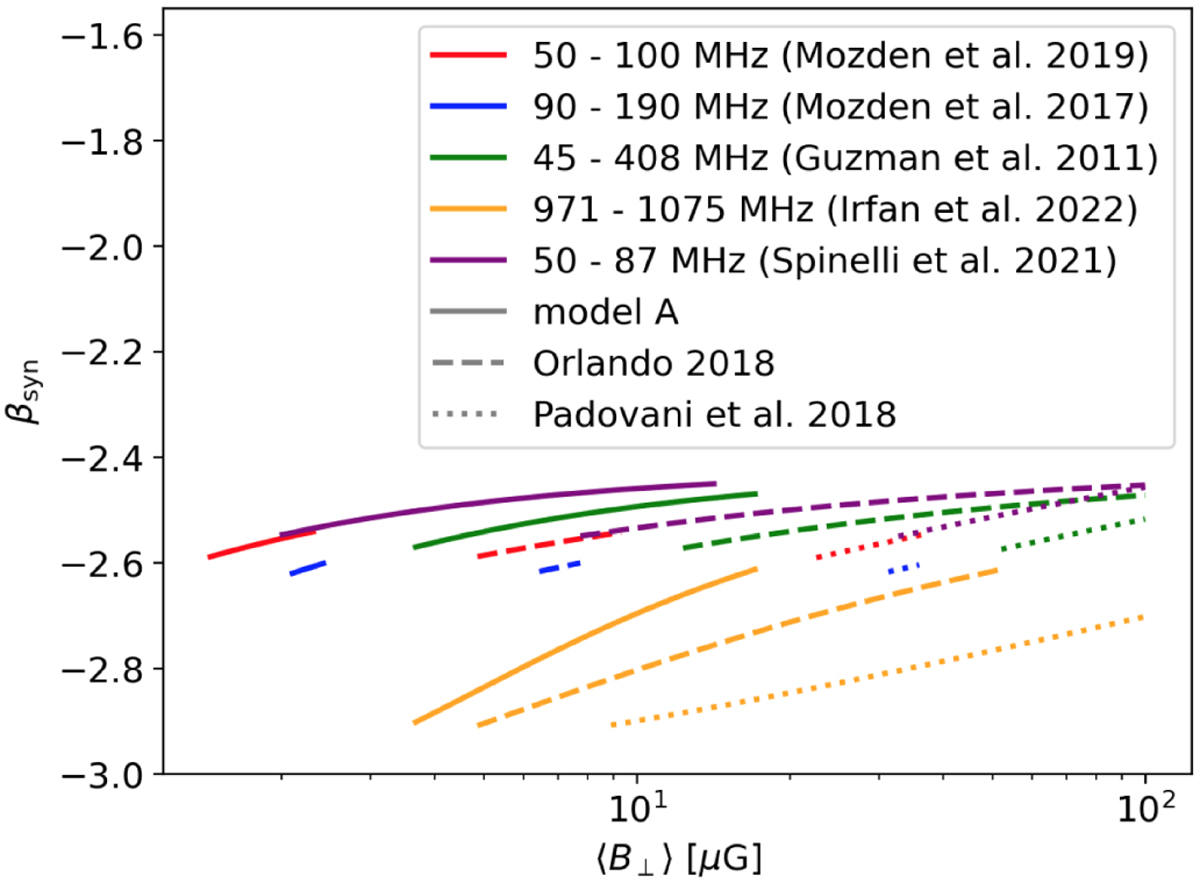
Modeled synchrotron spectral indices, βsyn, reproducing various observational results of βobs (in different colors) with model A (solid lines), Orlando (2018, dashed lines), and Padovani et al. (2018, dotted lines). Data are the following: 50–100 MHz (red), and 90–190 MHz (blue) using EDGES (Mozdzen et al. 2017, 2019); 45–408 MHz using a set of multiple observations (G11); 971–1075 MHz using MeerKAT (Irfan et al. 2022); 50 and 87 MHz using LEDA (Spinelli et al. 2021).
Current usage metrics show cumulative count of Article Views (full-text article views including HTML views, PDF and ePub downloads, according to the available data) and Abstracts Views on Vision4Press platform.
Data correspond to usage on the plateform after 2015. The current usage metrics is available 48-96 hours after online publication and is updated daily on week days.
Initial download of the metrics may take a while.