Open Access
Fig. 4
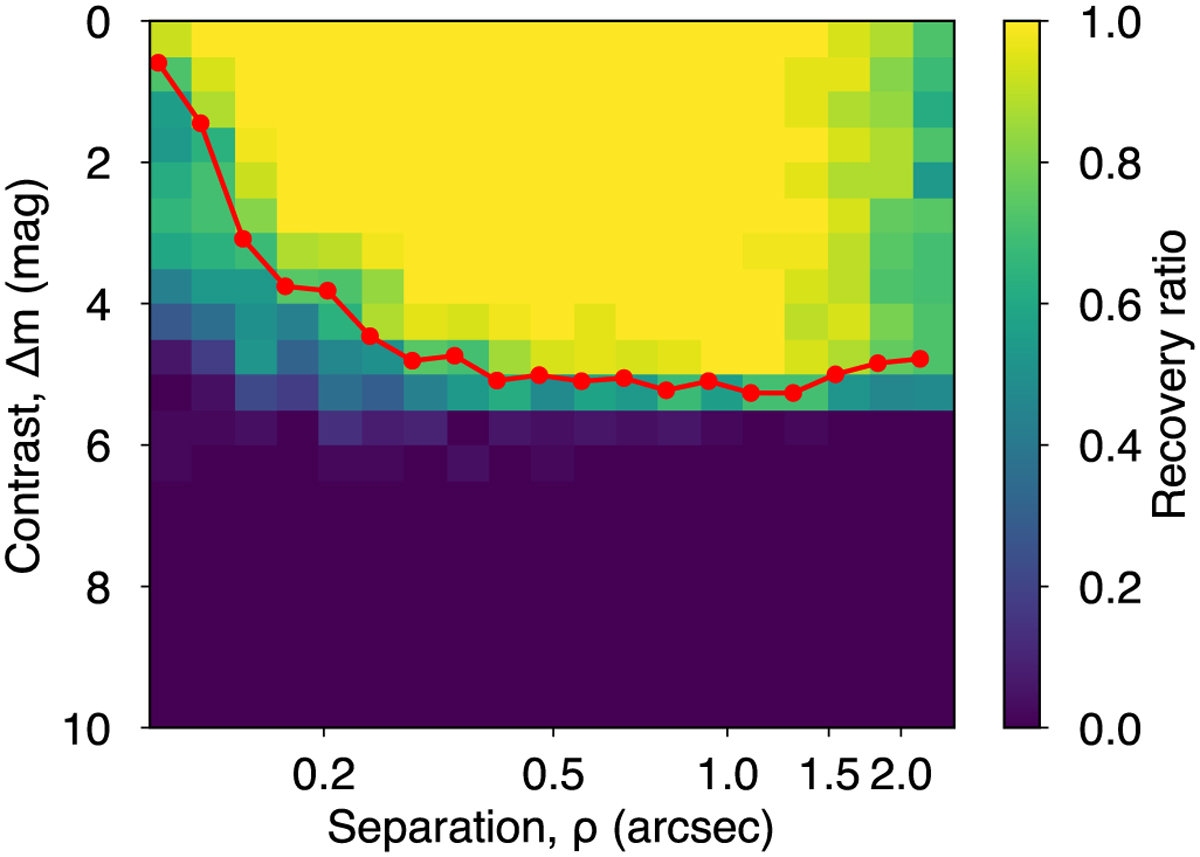
Download original image
Example of an injection-recovery matrix for one of our targets (TOI-1276). The color code indicates the rate of injected sources recovered. The red line represents the 70% recovery contour assumed to be the sensitivity curve (see Sect. 3.2).
Current usage metrics show cumulative count of Article Views (full-text article views including HTML views, PDF and ePub downloads, according to the available data) and Abstracts Views on Vision4Press platform.
Data correspond to usage on the plateform after 2015. The current usage metrics is available 48-96 hours after online publication and is updated daily on week days.
Initial download of the metrics may take a while.