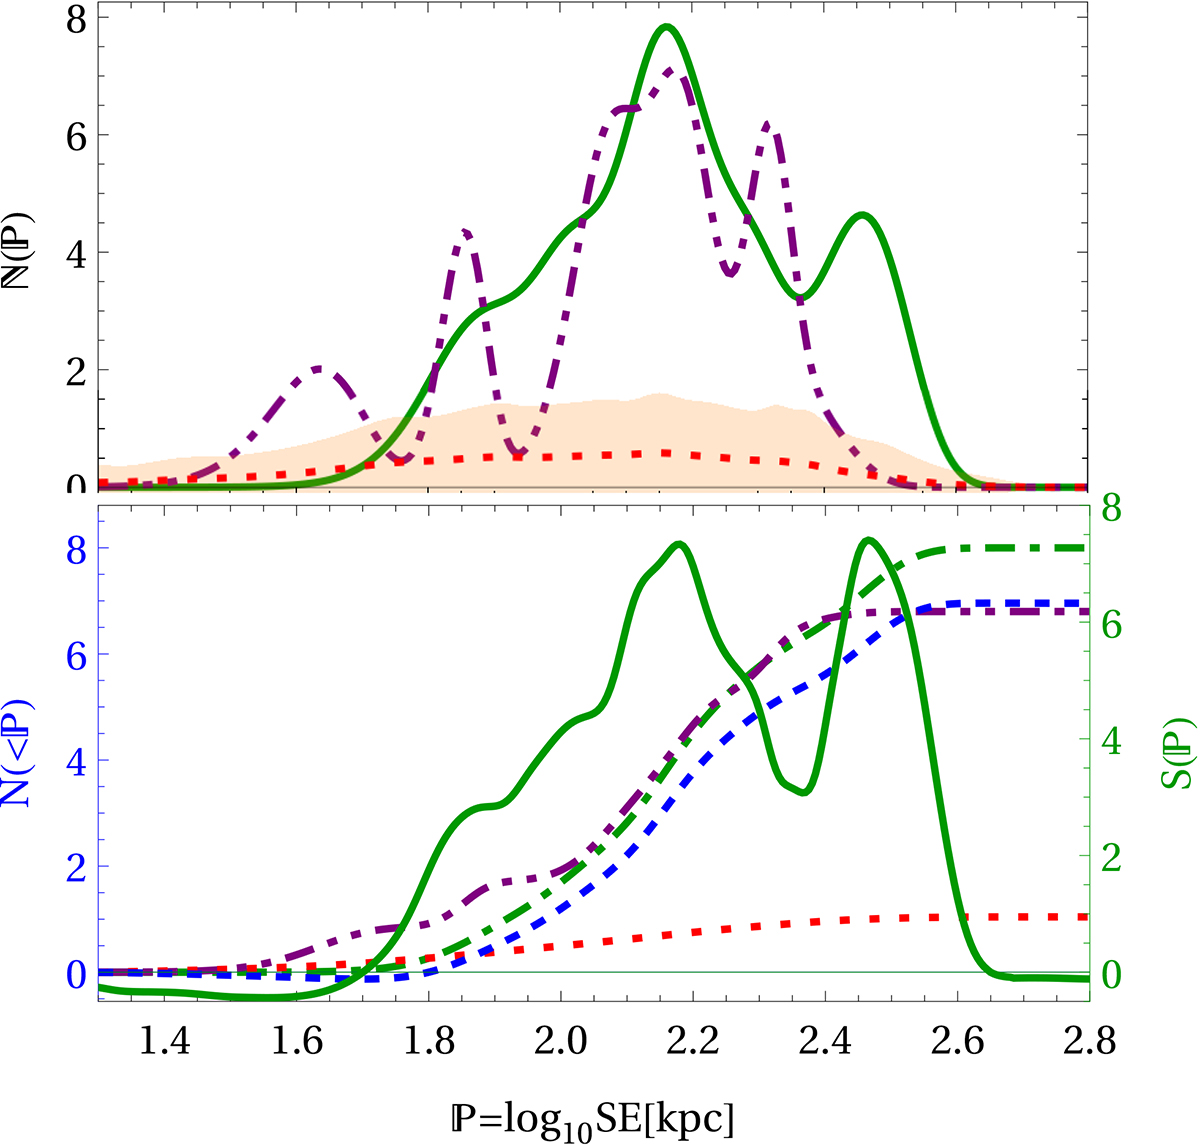
Fig. 4.
Download original image
SE distribution for nominal cuts (F > Fth and mass bins 2–4). Differential distributions (ℕ(ℙ); top panel) and cumulative distributions (N(< ℙ); bottom panel, left axis) are shown for ℙ = log10SE in the VS bin (solid and dot-dashed green lines), ICM region (double dot-dashed purple), field sampling (dotted red; pink-shaded 1σ dispersion), and VS excess (dashed blue). The bottom panel also shows the local significance, S(ℙ), of the VS excess (solid green curve, right axis).
Current usage metrics show cumulative count of Article Views (full-text article views including HTML views, PDF and ePub downloads, according to the available data) and Abstracts Views on Vision4Press platform.
Data correspond to usage on the plateform after 2015. The current usage metrics is available 48-96 hours after online publication and is updated daily on week days.
Initial download of the metrics may take a while.