Fig. 1.
Download original image
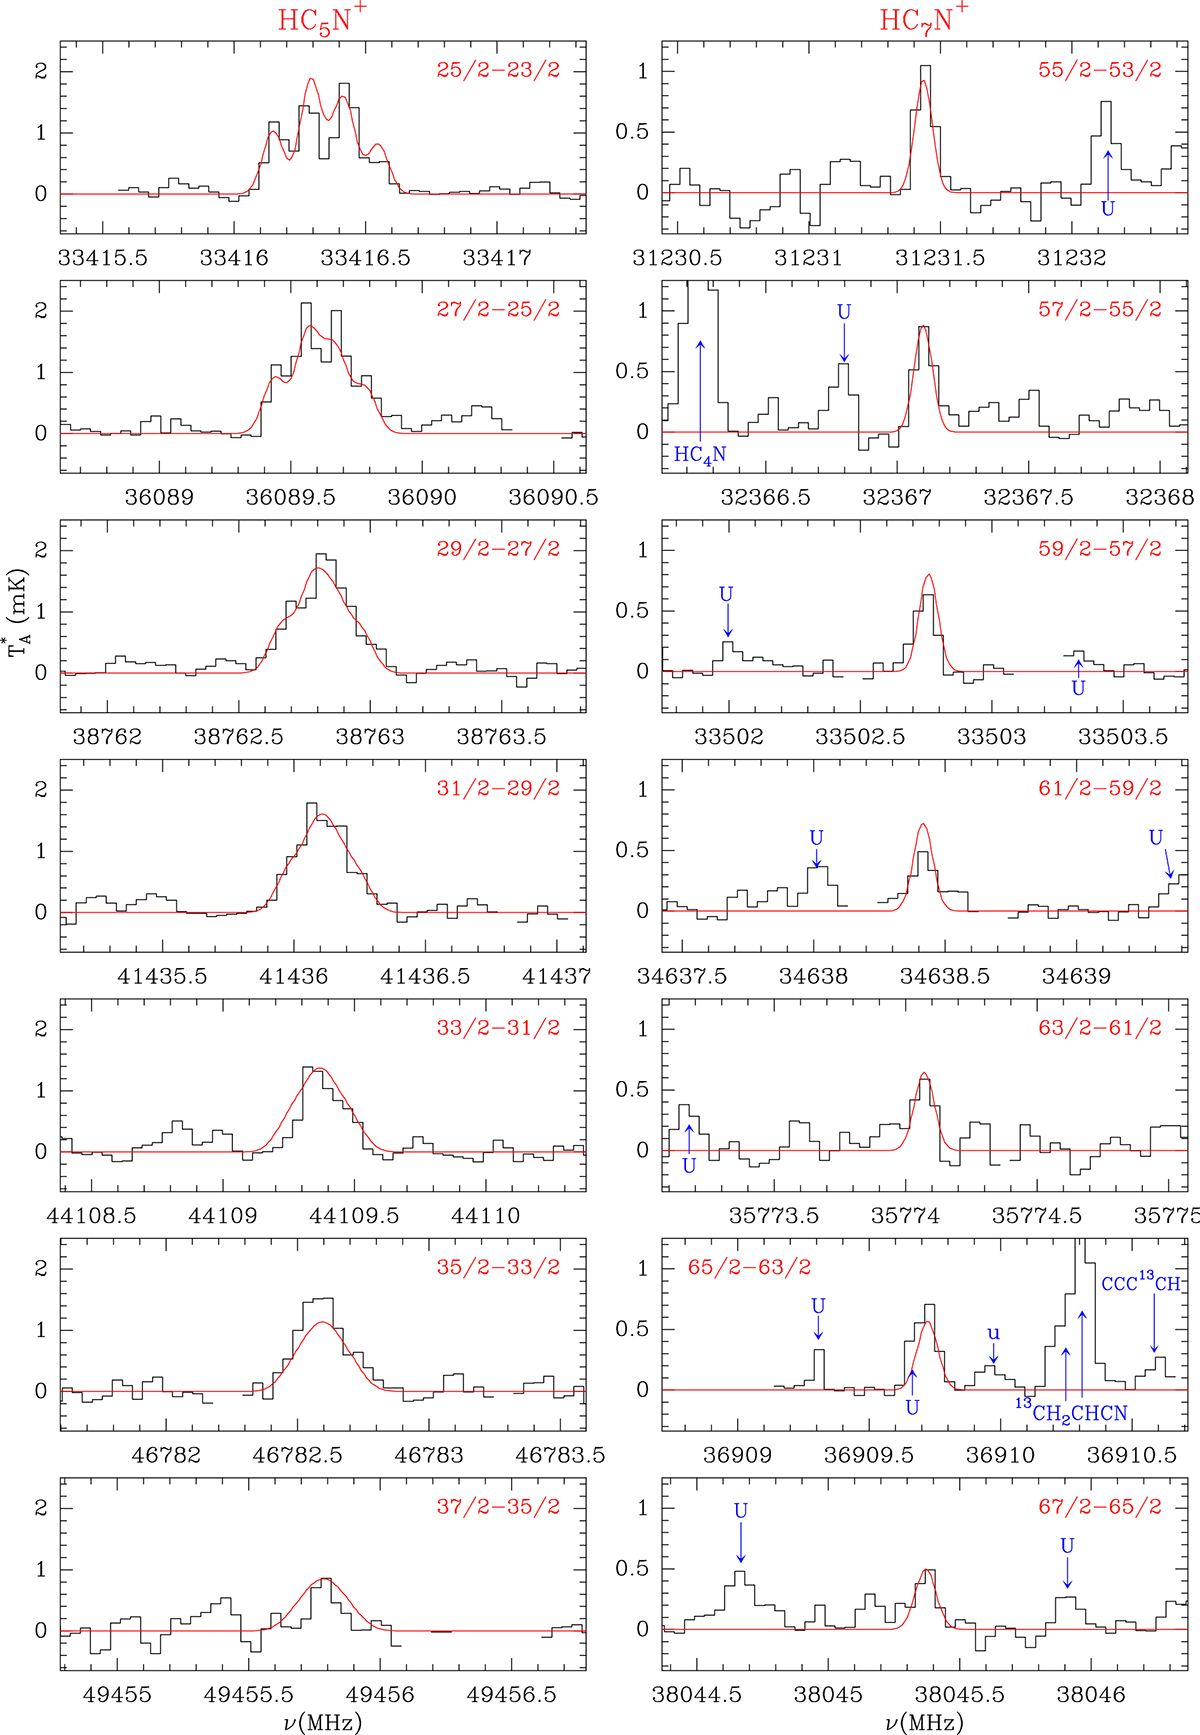
Observed transitions of HC5N+ (left column) and HC7N+ (right column) in TMC-1. Quantum numbers are indicated at the top right of each panel. The abscissa corresponds to the rest frequency. The ordinate is the antenna temperature, corrected for atmospheric and telescope losses, in milli Kelvin. Blanked channels correspond to negative features produced when folding the frequency-switched data. The red line shows the computed synthetic spectra for the lines of the two species (see Sects. 3.1 and 3.2). The physical parameters used for the models are given in Sect. 3.3. The centroids of the modelled lines of HC5N+ have been fixed to the observed ones (see Table A.1) and the simulated hyperfine components have been added to these centroids. For HC7N+ the line frequencies are given in Table A.2.
Current usage metrics show cumulative count of Article Views (full-text article views including HTML views, PDF and ePub downloads, according to the available data) and Abstracts Views on Vision4Press platform.
Data correspond to usage on the plateform after 2015. The current usage metrics is available 48-96 hours after online publication and is updated daily on week days.
Initial download of the metrics may take a while.