Fig. C.1.
Download original image
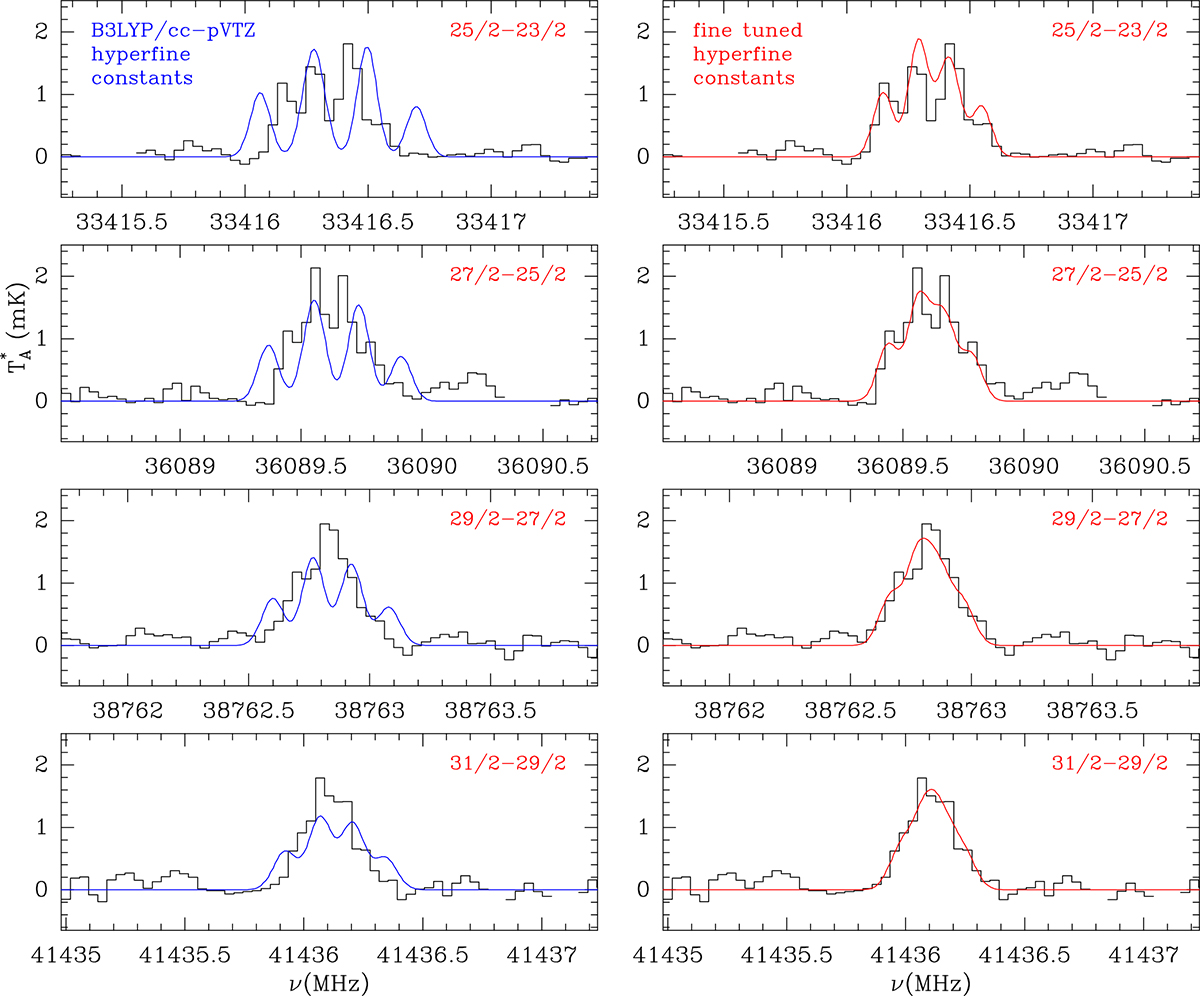
Same as Fig. 1, but comparing observations with modelled spectra using the hyperfine constants of HC5N+ derived from our quantum chemical calculations (see App. C). The blue spectra in the left panels show the modelled lines. The panels of the right column show in red the final modelled spectra after fine-tuning the hyperfine constants (identical to those shown in Fig. 1). The centroids of the modelled lines of HC5N+ in both columns have been fixed to the observed ones (see Table A.1).
Current usage metrics show cumulative count of Article Views (full-text article views including HTML views, PDF and ePub downloads, according to the available data) and Abstracts Views on Vision4Press platform.
Data correspond to usage on the plateform after 2015. The current usage metrics is available 48-96 hours after online publication and is updated daily on week days.
Initial download of the metrics may take a while.