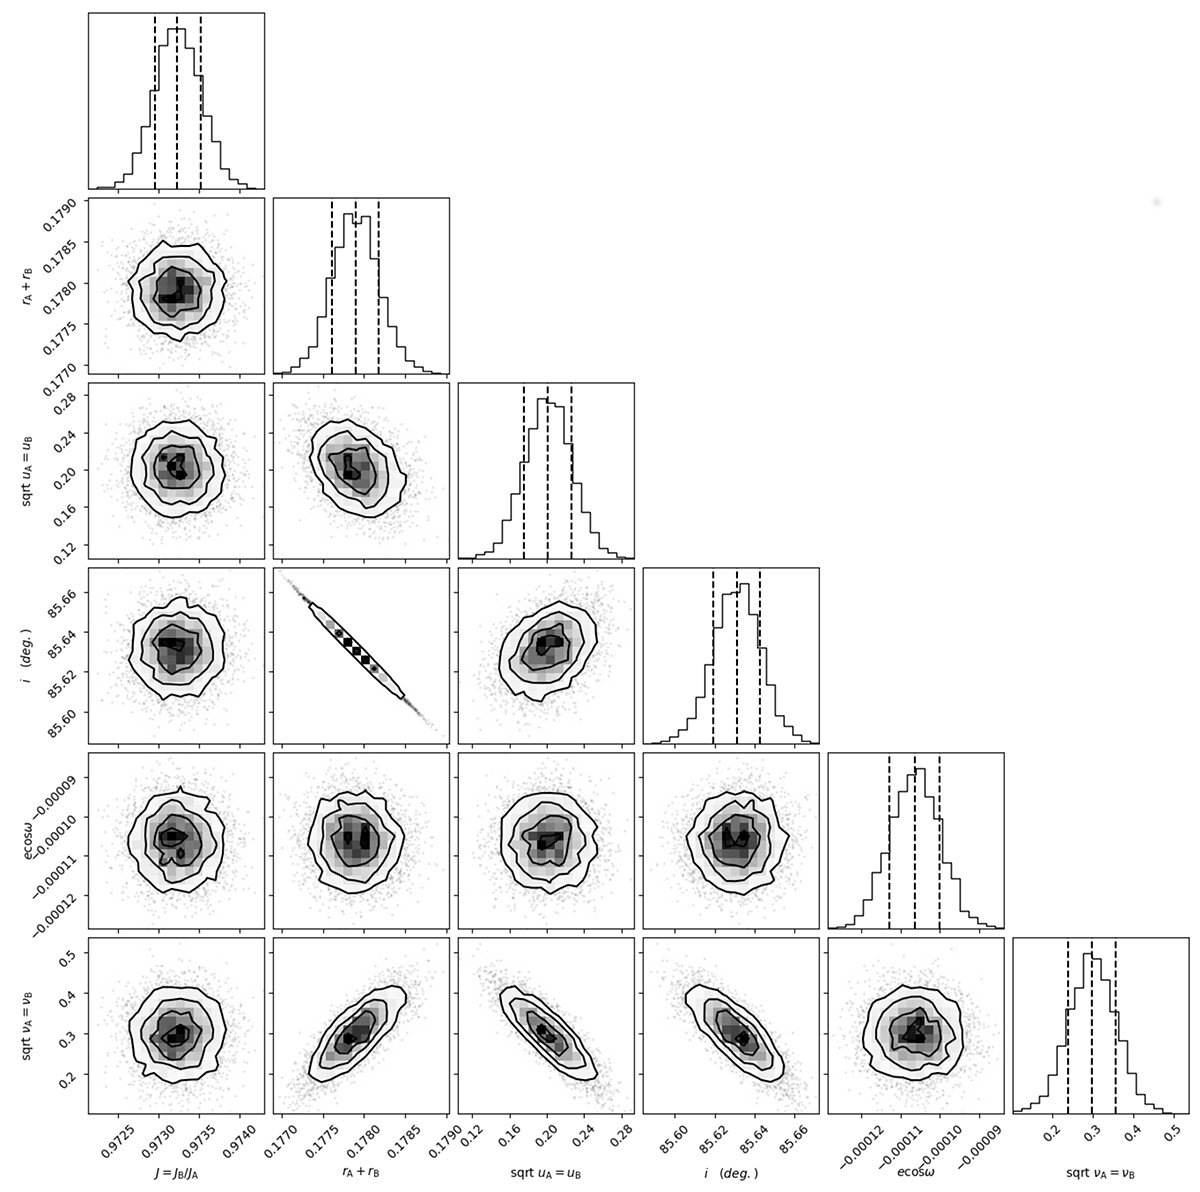
Fig. C.1.
Download original image
Parameter uncertainty covariances and parameter parent distributions of light curve parameter based on TESS data analysis. We show the results from JKTEBOP task8 (MC, 5000 samples). We plot 16%, 50% and 84% quantiles for each histogram and 1σ, 2σ and 3σ confidence regions as contours. A strong negative correlation is found between the inclination (i) and sum of fractional radii (rA + rB). We omit the explicit calculation of the correlation coefficients. The orbital period (P) and reference epoch (T0) have been omitted since their covariance has been minimized by construction already. We do not show the results from PB-RP due to a low number of samples resulting in technical complications in rendering correct confidence limits. However, parameter covariances between MC and PB-RP are similar. The plots were generated with CORNER (Foreman-Mackey 2016).
Current usage metrics show cumulative count of Article Views (full-text article views including HTML views, PDF and ePub downloads, according to the available data) and Abstracts Views on Vision4Press platform.
Data correspond to usage on the plateform after 2015. The current usage metrics is available 48-96 hours after online publication and is updated daily on week days.
Initial download of the metrics may take a while.