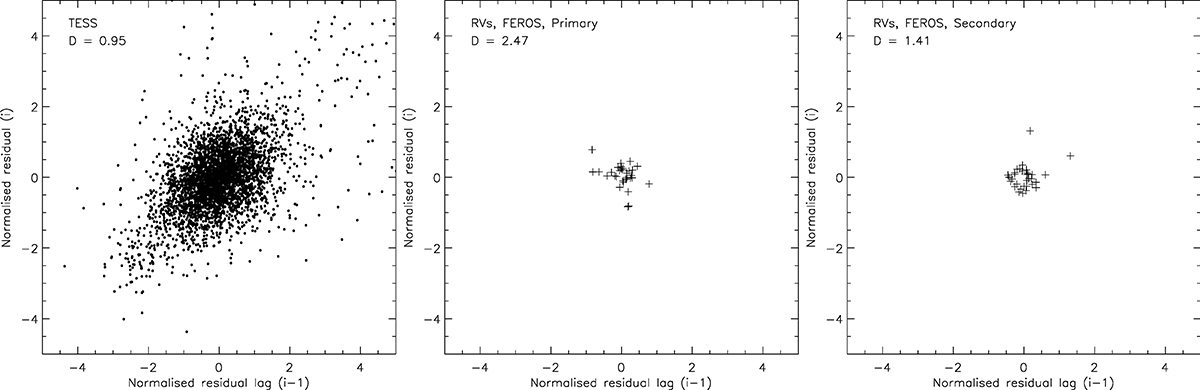
Fig. 7.
Download original image
Durbin-Watson (lag) plots for the three different data sets: TESS, RVs of star A, and RVs of star B. A 𝒟 = 2.0 indicates no auto-correlation with data randomly distributed following a standard normal distribution. For the TESS data and the RV data of star B (based on two outliers) we see a positive auto-correlation, while for the RVs of star A we see a negative auto-correlation.
Current usage metrics show cumulative count of Article Views (full-text article views including HTML views, PDF and ePub downloads, according to the available data) and Abstracts Views on Vision4Press platform.
Data correspond to usage on the plateform after 2015. The current usage metrics is available 48-96 hours after online publication and is updated daily on week days.
Initial download of the metrics may take a while.