Fig. 2
Download original image
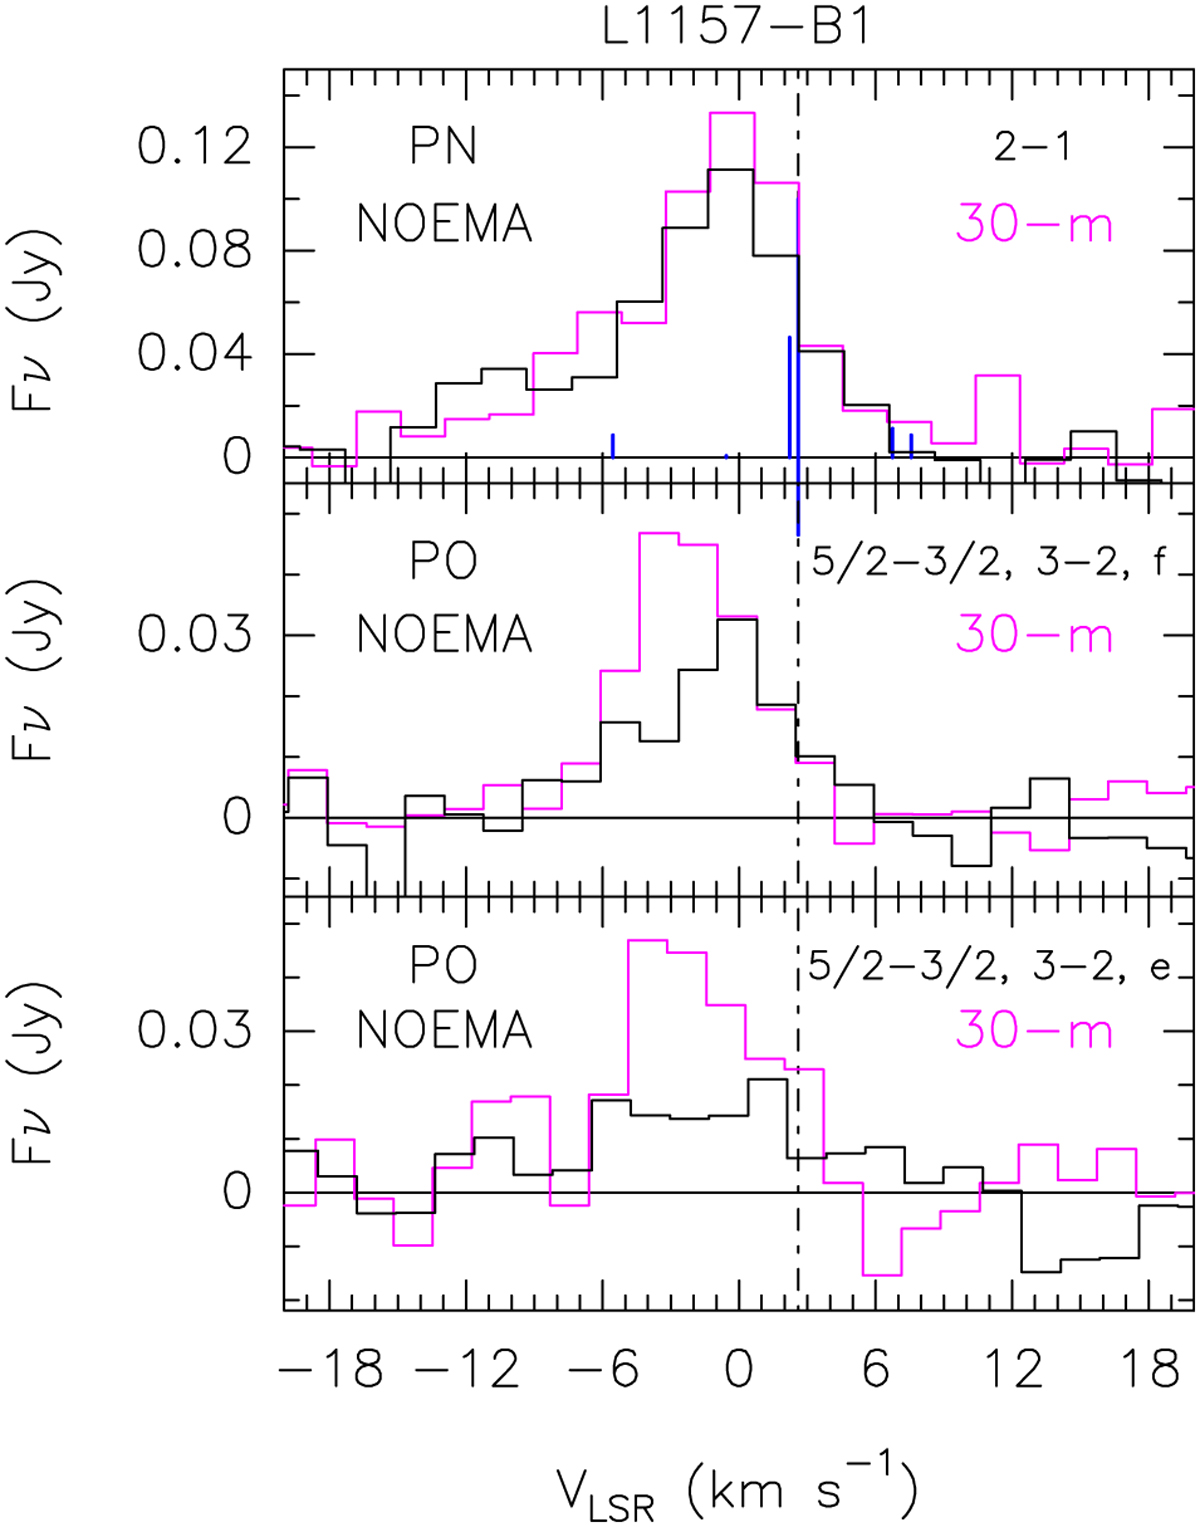
Top: comparison in flux density scale between the PN and PO spectra as observed using the IRAM 30 m antenna (magenta, Lefloch et al. 2016) and that extracted from the NOEMA map (black) from a circular region equal to the IRAM 30m HPBW. Top: PN N= 2–1 spectra. The HPBW is 26″.2. The vertical dot-dashed line marks the systemic velocity of L1157-mm (V = +2.7 km s−1). The blue lines indicate the frequencies of the ΔJ = 0, ±1 transitions of the N = 2–1 pattern (see Table 1). Middle: same as in the top panel but for the PO 2Π1/2 J = 5/2–3/2 F = 3–2 f transition (IRAM 30 m beam: 22″.6). Bottom: same as in the middle panel but for the PO transition 2Π1/2 J = 5/2–3/2 F = 3–2 e.
Current usage metrics show cumulative count of Article Views (full-text article views including HTML views, PDF and ePub downloads, according to the available data) and Abstracts Views on Vision4Press platform.
Data correspond to usage on the plateform after 2015. The current usage metrics is available 48-96 hours after online publication and is updated daily on week days.
Initial download of the metrics may take a while.