Fig. 5
Download original image
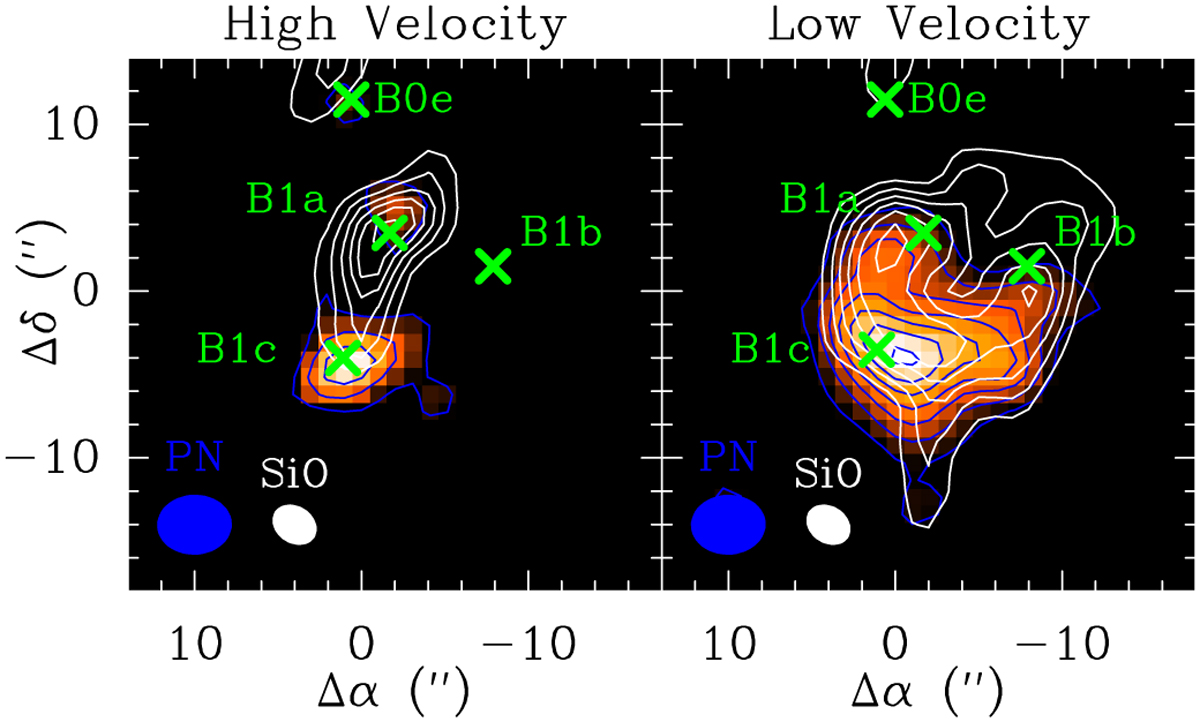
Comparison of the PN N = 2–1 and SiO J = 2–1 line emissions. Left: high-velocity range. The PN N = 2–1 line flux (colourscale and red contours) is integrated in the velocity interval [−11;−5.3] km s−1; the first contour and contour interval are 3σ (1.8 × 10⁻² Jy beam−1 km s−1) and 2σ (1.2 × 10⁻² Jy beam−1 km s−1), respectively. The SiO J = 2–1 emission (white contours) is integrated in the velocity interval [−19.7;−6.7] km s−1; the first contour and contour interval are 20% and 15% of the SiO peak intensity, respectively. Right: low-velocity range. The PN N = 2–1 line flux is integrated in the velocity interval [−5.3;+4.6] km s−1; the first contour and contour interval are 3σ (2.5 × 10⁻² Jy beam−1 km s−1) and 2σ (1.6 × 10⁻² Jy beam−1 km s−1), respectively. The SiO J = 2–1 emission is integrated in the velocity interval [−6.7; +3.7] km s−1; the first contour and contour interval are 20% and 15% of the SiO peak intensity, respectively. The red and white ellipses depict the synthesised beams of the PN N = 2–1 and SiO J = 2–1 observations, respectively. Coordinates are in arcsecond offsets with respect to the nominal position of B1.
Current usage metrics show cumulative count of Article Views (full-text article views including HTML views, PDF and ePub downloads, according to the available data) and Abstracts Views on Vision4Press platform.
Data correspond to usage on the plateform after 2015. The current usage metrics is available 48-96 hours after online publication and is updated daily on week days.
Initial download of the metrics may take a while.