Fig. 7
Download original image
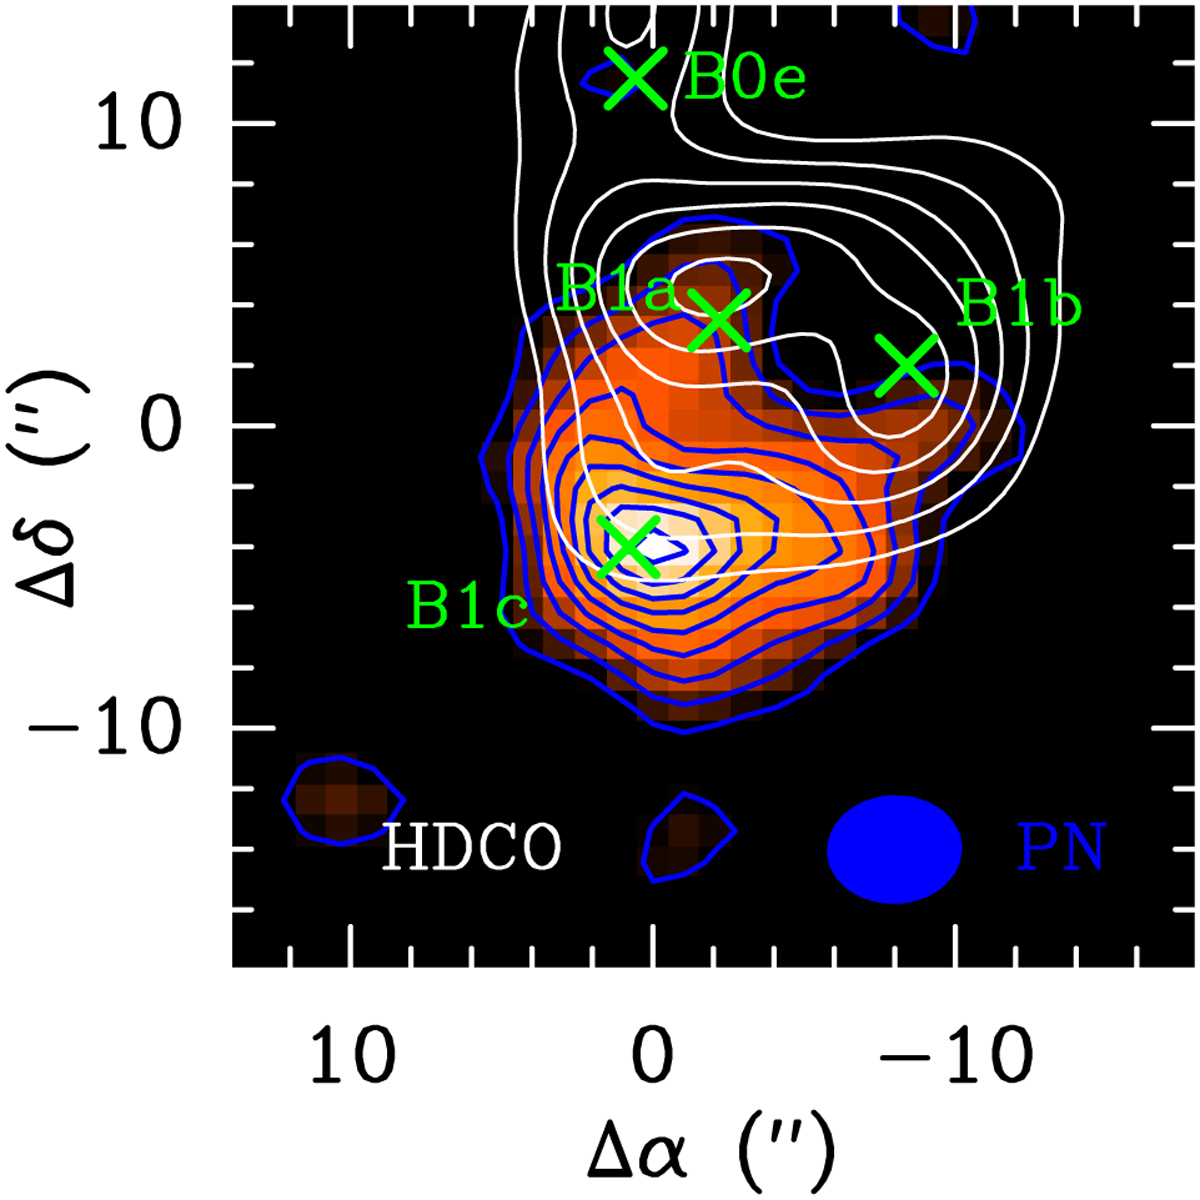
Comparison of the PN N = 2–1 and HDCO J = 2–1 flux distributions. The PN N = 2–1 line flux (colourscale and bluecontours) is integrated in the velocity interval [−11;+4.6] km s−1; the first contour and contour interval are 3σ (2.8 × 10⁻² Jy beam−1 km s−1) and 2σ (1.8 × 10⁻² Jybeam−1 km s−1), respectively. The synthesized beam of the PN N = 2–1 is depicted by a blue ellipse in the bottom right corner. The HDCO J = 41,4−31,3 emission (white contours) is integrated in the velocity interval [−0.7;+3.4] km s−1; the first contour and contour interval are 20% and 15% of the peak intensity, respectively. The map was smoothed down to the angular resolution of the PN N = 2–1 line. The HDCO J = 2–1 data are from Fontani et al. (2014). Coordinates are in arcsecond offsets with respect to the nominal position of L1157-B1.
Current usage metrics show cumulative count of Article Views (full-text article views including HTML views, PDF and ePub downloads, according to the available data) and Abstracts Views on Vision4Press platform.
Data correspond to usage on the plateform after 2015. The current usage metrics is available 48-96 hours after online publication and is updated daily on week days.
Initial download of the metrics may take a while.