Fig. 12
Download original image
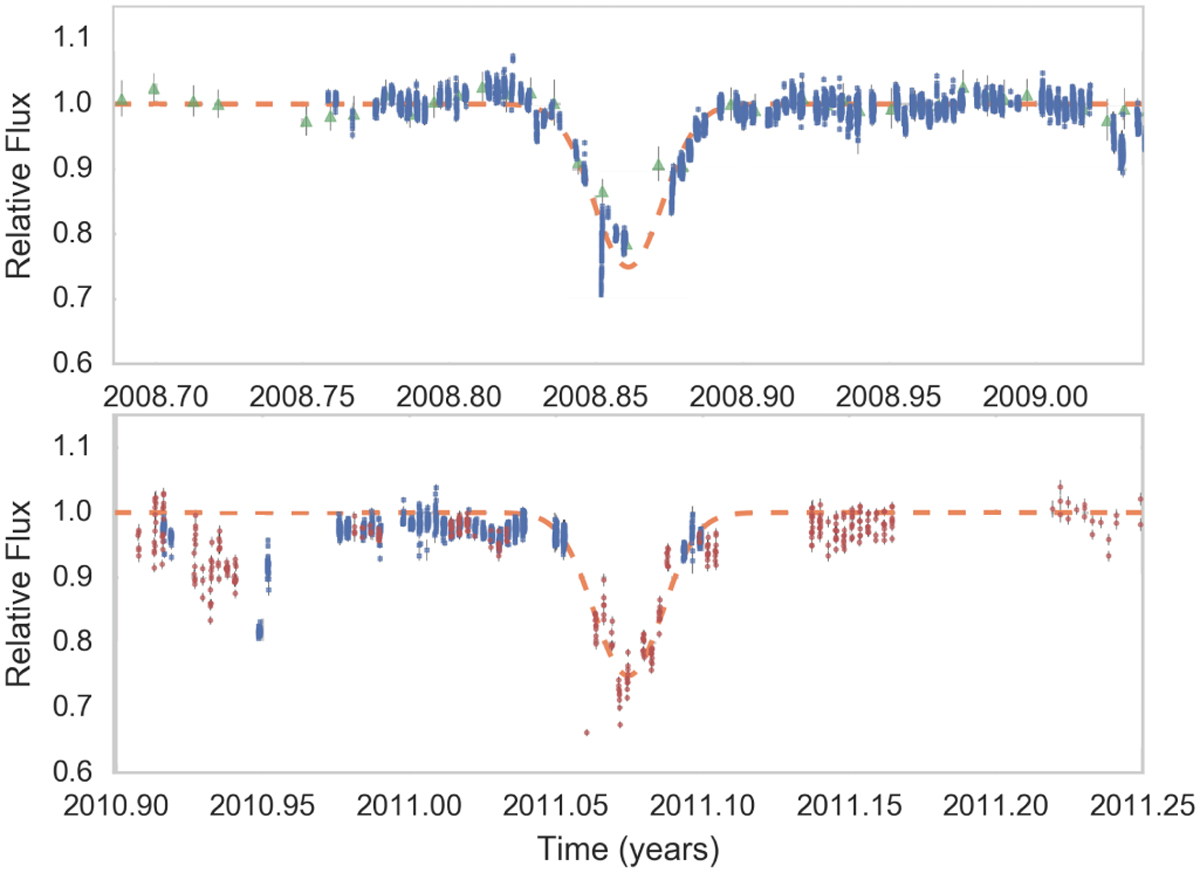
Solutions that ignore transmission scaling, ƒT,x = 1, are in blue, and the solutions that do not are in orange. PDS 110 light curve. Top: first eclipse from 2008. Bottom: second eclipse from 2011. The red circles are data from KELT, the blue squares is data from SuperWASP, the green triangles are data from ASAS. The best fit eclipse model is over-plotted in orange with parameters in Table 5. This figure is extracted from the bottom left panels of Fig. 1 from Osborn et al. (2017).
Current usage metrics show cumulative count of Article Views (full-text article views including HTML views, PDF and ePub downloads, according to the available data) and Abstracts Views on Vision4Press platform.
Data correspond to usage on the plateform after 2015. The current usage metrics is available 48-96 hours after online publication and is updated daily on week days.
Initial download of the metrics may take a while.