Open Access
Fig. 14
Download original image
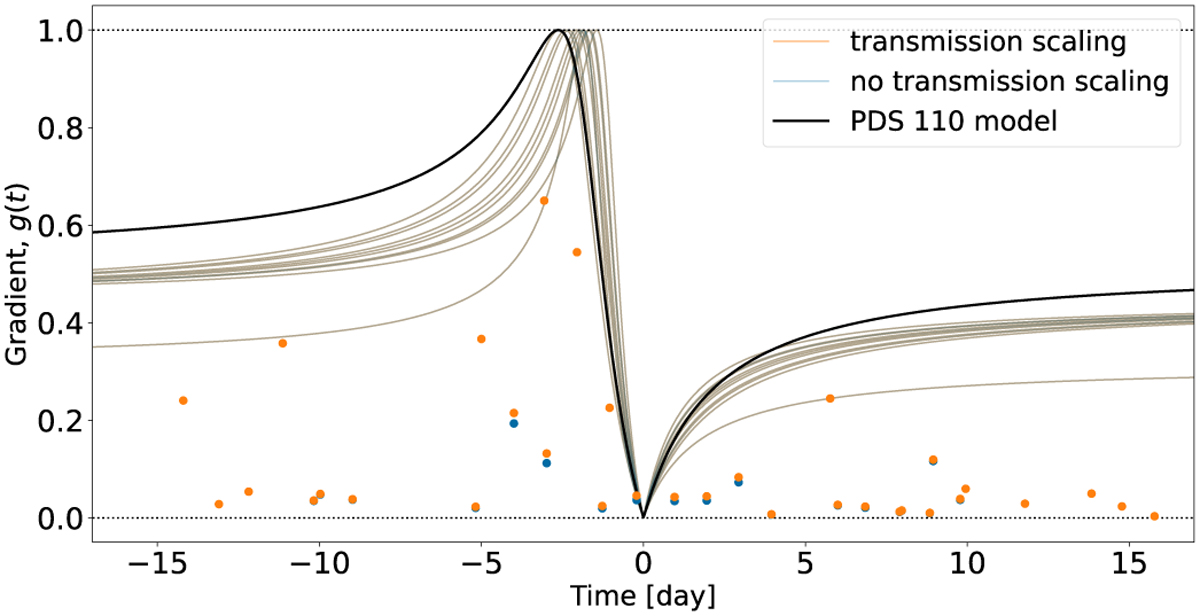
PDS 110 projected gradients. The projected gradients are plotted for the ring system models depicted in Fig. 10. Note: the orange data points make use of fT and the PDS 110 model (black) does not (fT = 1). Solutions that ignore transmission scaling, fT,x = 1, are in blue, and the solutions that do not are in orange.
Current usage metrics show cumulative count of Article Views (full-text article views including HTML views, PDF and ePub downloads, according to the available data) and Abstracts Views on Vision4Press platform.
Data correspond to usage on the plateform after 2015. The current usage metrics is available 48-96 hours after online publication and is updated daily on week days.
Initial download of the metrics may take a while.