Fig. 6
Download original image
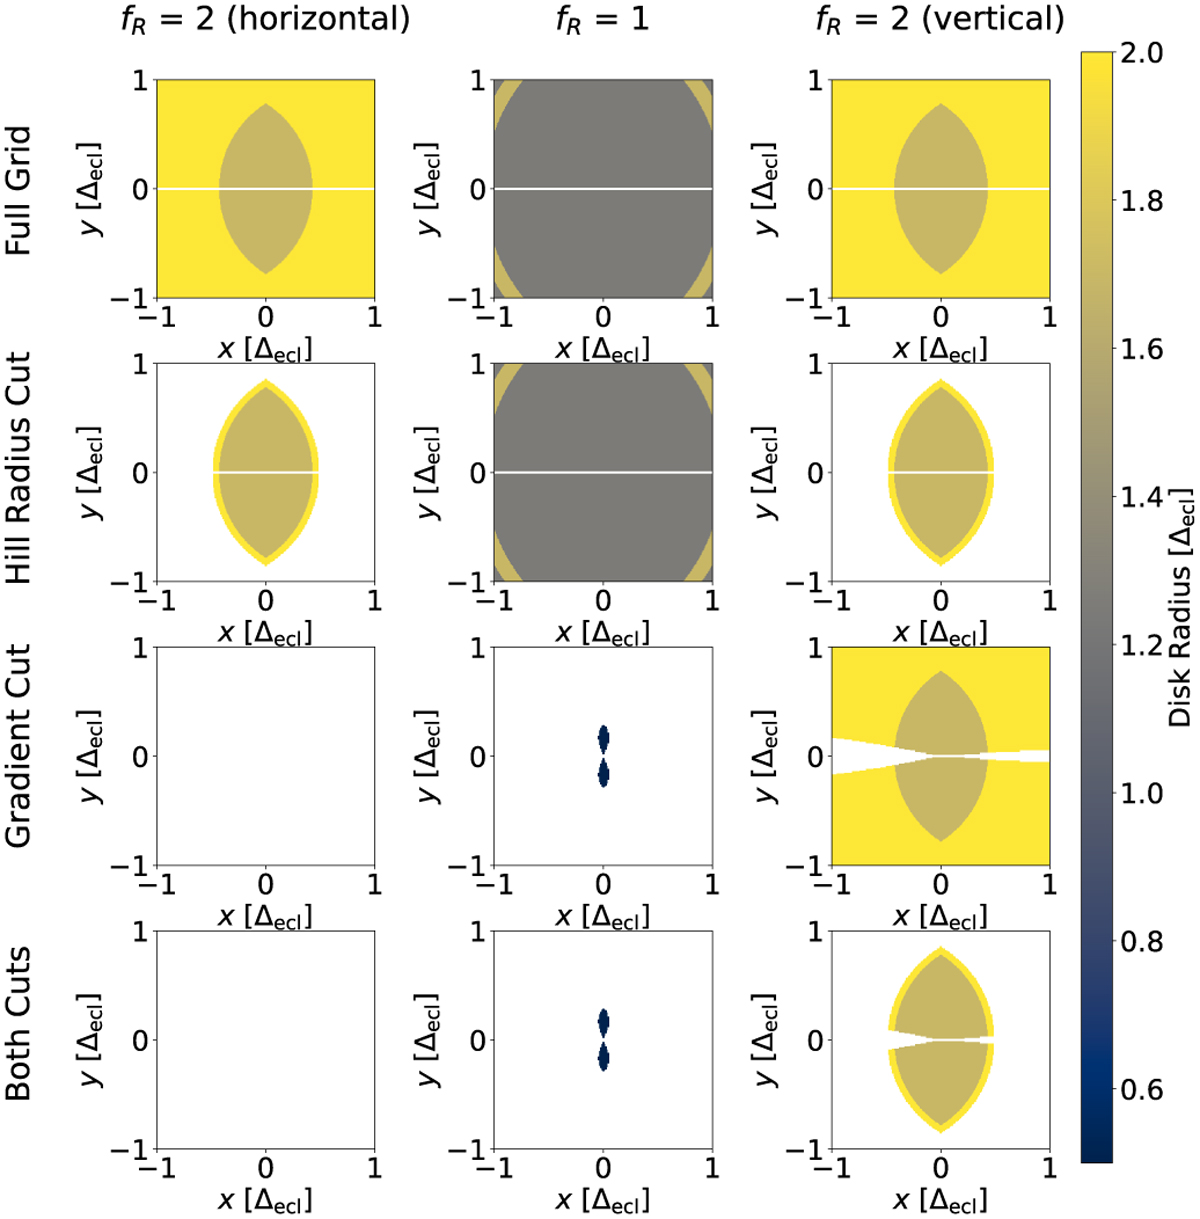
Shallot visualisation of the disc radius. The first row shows the full extent of the grid with no restrictions applied. The second row shows the grid after applying just a Hill radius cut at 2 ∆ecl. The third row shows the grid after applying just a cut due to a projected gradient at t = 0.45 ∆ecl with a value of g(t) = 0.1. The fourth row shows the grid after applying both the projected gradient and Hill radius cut. Left: grid slice with ƒR = 2 when the disc is stretched horizontally. Middle: grid slice with the minimum radius disc (ƒR = 1). Right: grid slice with ƒR = 2 when the disc is stretched vertically.
Current usage metrics show cumulative count of Article Views (full-text article views including HTML views, PDF and ePub downloads, according to the available data) and Abstracts Views on Vision4Press platform.
Data correspond to usage on the plateform after 2015. The current usage metrics is available 48-96 hours after online publication and is updated daily on week days.
Initial download of the metrics may take a while.