Fig. 2.
Download original image
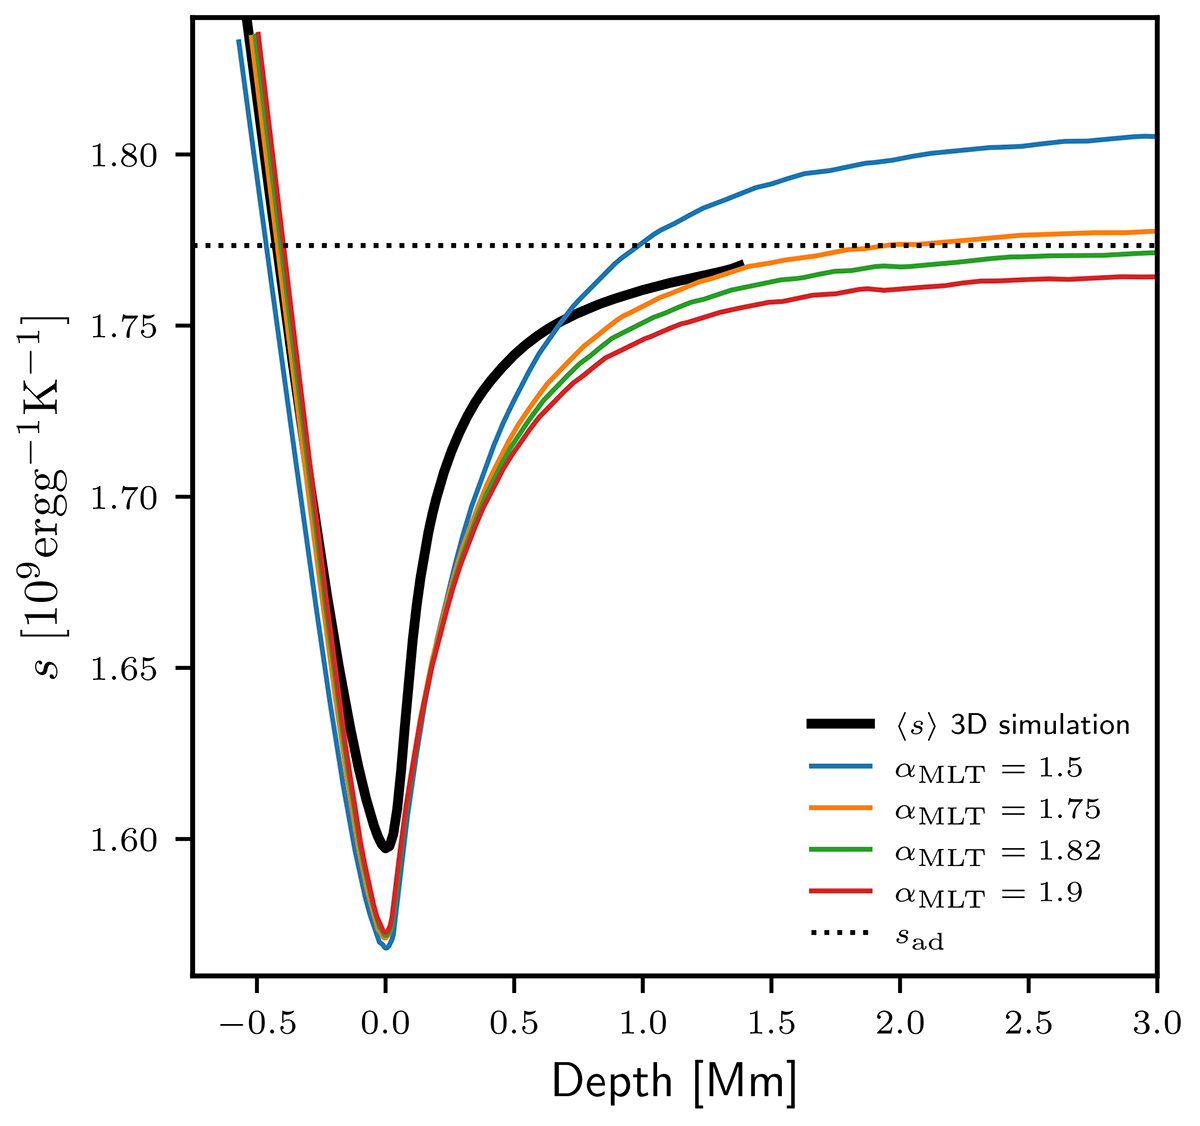
Profile of specific entropy as a function of the depth in the model. The origin of the depth is taken as the location of then entropy minimum in the superadiabatic region. Average specific entropy profile of a 3D simulation is represented as a solid black line, and the entropy of the adiabat as a dash black line. The entropy of the adiabat is an input of the 3D model. Other curves are profiles of specific entropy obtained with 1D models computed with different values of αMLT = 1.5 (blue), 1.75 (orange), 1.82 (green), and 1.9 (red).
Current usage metrics show cumulative count of Article Views (full-text article views including HTML views, PDF and ePub downloads, according to the available data) and Abstracts Views on Vision4Press platform.
Data correspond to usage on the plateform after 2015. The current usage metrics is available 48-96 hours after online publication and is updated daily on week days.
Initial download of the metrics may take a while.