Open Access
Fig. H.1
Download original image
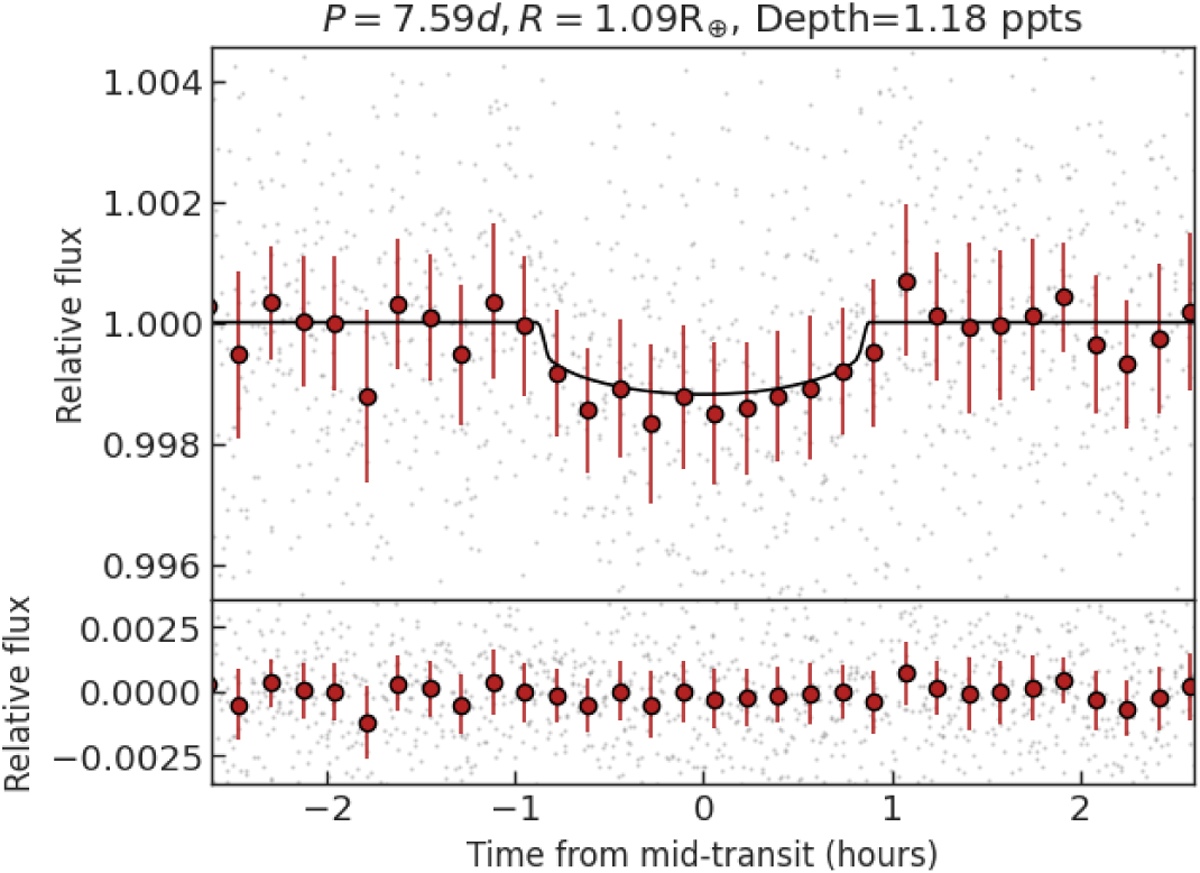
Transit model of TIC 166184428.02. Top panel: phase folded photometry of TIC 166184428.02. The best-fit model is shown in solid black. The grey points are the raw flux and the red points are the 15-minutes binned flux. Bottom panel: residuals of the best-fit model.
Current usage metrics show cumulative count of Article Views (full-text article views including HTML views, PDF and ePub downloads, according to the available data) and Abstracts Views on Vision4Press platform.
Data correspond to usage on the plateform after 2015. The current usage metrics is available 48-96 hours after online publication and is updated daily on week days.
Initial download of the metrics may take a while.