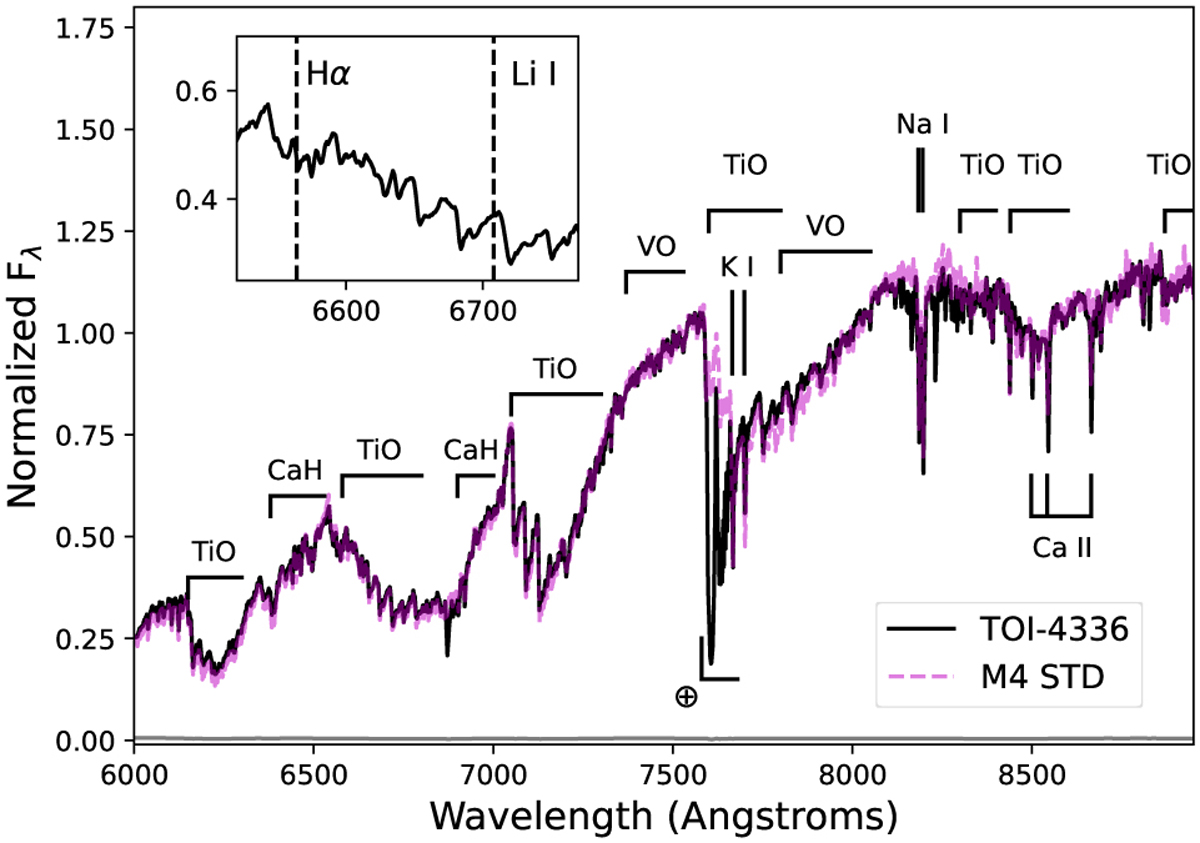
Fig. 2
Download original image
LDSS3 red optical spectrum of TOI-4336 A (black line), compared to its best-fit M4 template (Kesseli et al. 2017, magenta line). Spectra are normalized in the 7400–7500 Å region, and major absorption features are labeled, including regions of strong telluric absorption (⊕). The inset box shows a close-up of the region encompassing Hα (6563 Å) and Li I (6708 Å) features, neither of which is detected.
Current usage metrics show cumulative count of Article Views (full-text article views including HTML views, PDF and ePub downloads, according to the available data) and Abstracts Views on Vision4Press platform.
Data correspond to usage on the plateform after 2015. The current usage metrics is available 48-96 hours after online publication and is updated daily on week days.
Initial download of the metrics may take a while.