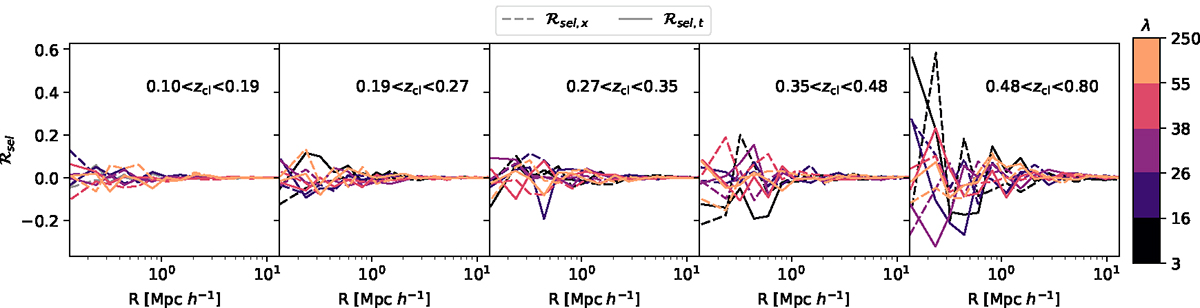
Fig. 11.
Download original image
Selection response of our tangential (full lines) and cross (dashed lines) shear estimator, averaged over artificial shears in the two Cartesian coordinates, as a function of cluster-centric distance, stacked in bins of cluster richness (color coded), and cluster redshift panels: lowest redshift left, higher redshift right. The selection response is very noisy but shows no significant trends with richness or cluster-centric distance.
Current usage metrics show cumulative count of Article Views (full-text article views including HTML views, PDF and ePub downloads, according to the available data) and Abstracts Views on Vision4Press platform.
Data correspond to usage on the plateform after 2015. The current usage metrics is available 48-96 hours after online publication and is updated daily on week days.
Initial download of the metrics may take a while.