Fig. 12.
Download original image
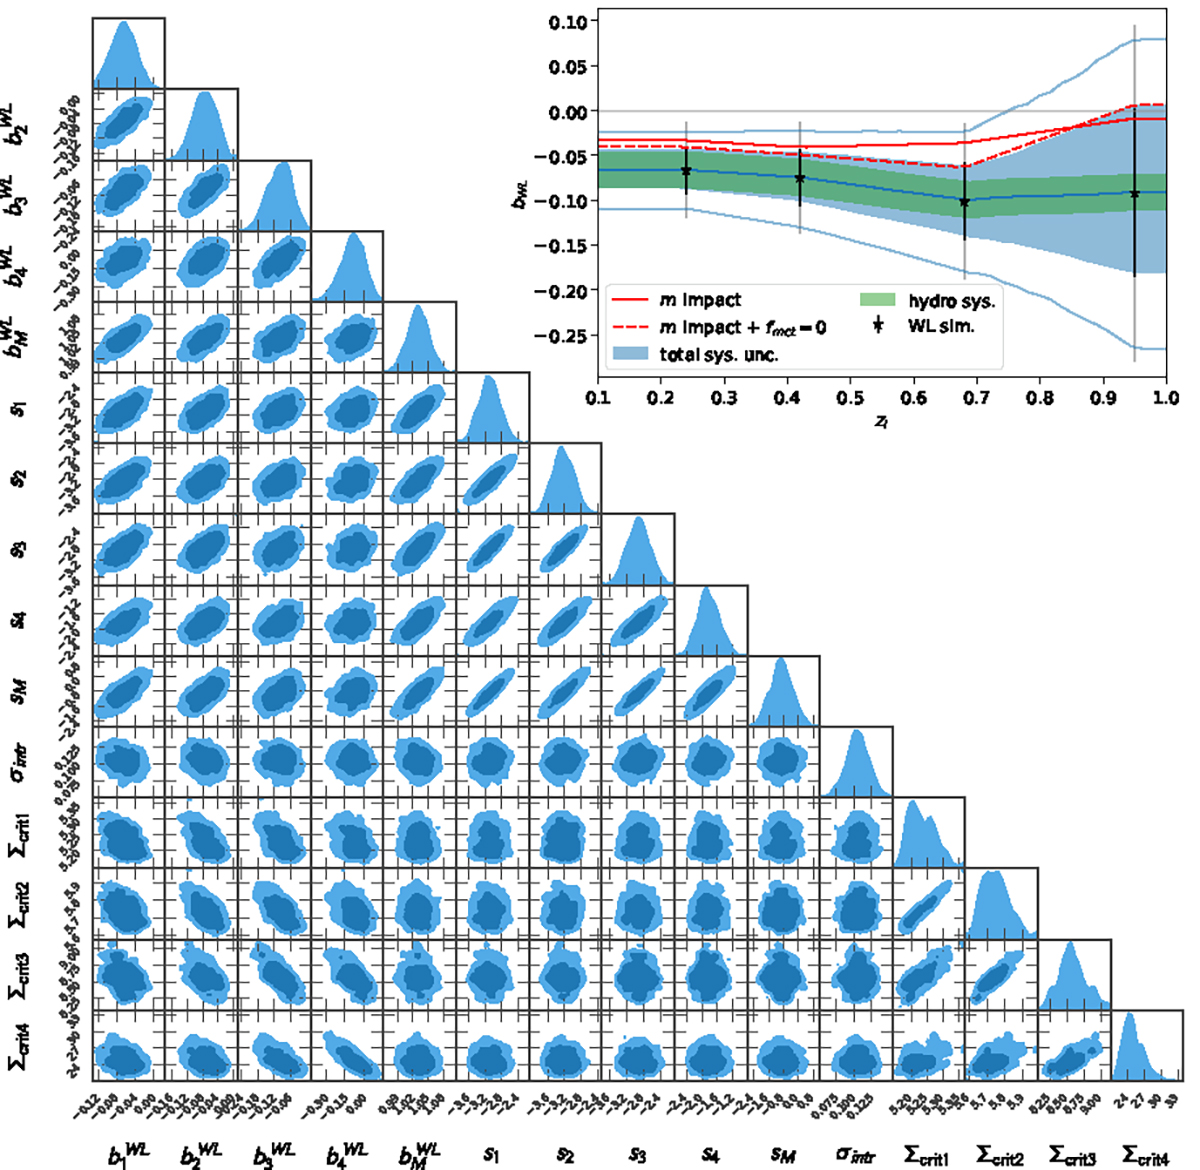
Joint distribution on the WL bias and scatter parameters ![]() , and their mass slopes (
, and their mass slopes (![]() , σM), along with the principal sources of systematic uncertainty: the lensing efficiencies Σcrit, l to the snapshots l, in units of 1015 h M⊙ Mpc−2, and the scale of the intrinsic mis-centering σintr. The high redshift biases anticorrelate with the respective lensing efficiencies, indicating that in this regime, we are limited by the DES Y3 photo-z accuracy. Conversely, the low redshift biases and the scatter values correlate among themselves, as they are dominated by the hydro uncertainty floor we added. Insert: Redshift interpolation of the WL lensing bias in cyan (filled region 1 sigma, faded lines 2 sigma), together with the 1 sigma uncertainty due to hydro modeling (green), explorations of the mean impact of the multiplicative shear bias m modeling (red), and the additional omission of the high mis-centering tail f = 0 (dashed red), and the posteriors of the WL bias in the four snap-shots. Hydrodynamical modeling uncertainties are dominant at low redshift. When considering our multiplicative shear bias modeling choices, the bias is consistent with zero, while the presence of the highly mis-centered tail does not affect the WL bias.
, σM), along with the principal sources of systematic uncertainty: the lensing efficiencies Σcrit, l to the snapshots l, in units of 1015 h M⊙ Mpc−2, and the scale of the intrinsic mis-centering σintr. The high redshift biases anticorrelate with the respective lensing efficiencies, indicating that in this regime, we are limited by the DES Y3 photo-z accuracy. Conversely, the low redshift biases and the scatter values correlate among themselves, as they are dominated by the hydro uncertainty floor we added. Insert: Redshift interpolation of the WL lensing bias in cyan (filled region 1 sigma, faded lines 2 sigma), together with the 1 sigma uncertainty due to hydro modeling (green), explorations of the mean impact of the multiplicative shear bias m modeling (red), and the additional omission of the high mis-centering tail f = 0 (dashed red), and the posteriors of the WL bias in the four snap-shots. Hydrodynamical modeling uncertainties are dominant at low redshift. When considering our multiplicative shear bias modeling choices, the bias is consistent with zero, while the presence of the highly mis-centered tail does not affect the WL bias.
Current usage metrics show cumulative count of Article Views (full-text article views including HTML views, PDF and ePub downloads, according to the available data) and Abstracts Views on Vision4Press platform.
Data correspond to usage on the plateform after 2015. The current usage metrics is available 48-96 hours after online publication and is updated daily on week days.
Initial download of the metrics may take a while.