Fig. 14.
Download original image
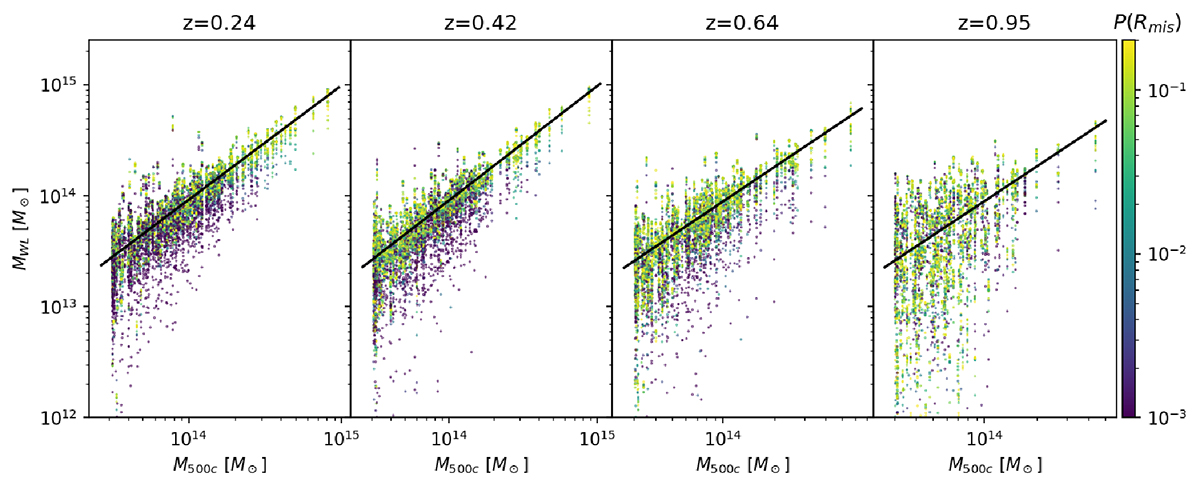
Scatter plot of the input halo mass versus the output WL mass from one realization of the synthetic shear profiles. Color coded by the value of the mis-centering distribution for that specific halos’ mis-centering, and as solid black lines, the mis-centering-distribution-weighted scaling between WL and halo mass, which results in an estimate for the WL bias. The scatter around this relation results in the WL scatter. Generally speaking, extreme outliers also have highly improbable mis-centering.
Current usage metrics show cumulative count of Article Views (full-text article views including HTML views, PDF and ePub downloads, according to the available data) and Abstracts Views on Vision4Press platform.
Data correspond to usage on the plateform after 2015. The current usage metrics is available 48-96 hours after online publication and is updated daily on week days.
Initial download of the metrics may take a while.