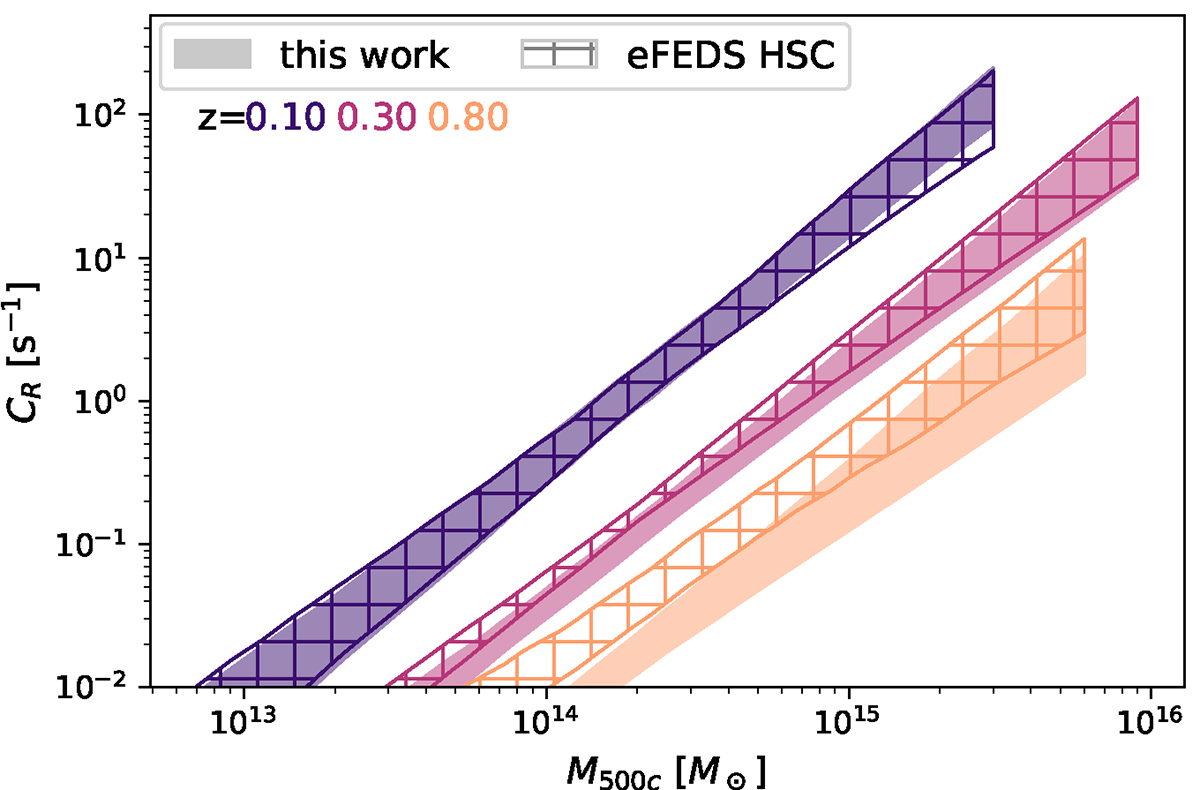
Fig. 16.
Download original image
Posterior predictive distribution of the mean count rate–mass relation (the band ranges from the 16th to the 84th percentile at each mass), for three different redshifts (color coded). Filled bands represent the analysis in this work, and hatched bands represent the eFEDS HSC result from Chiu et al. (2022). The predictions diverge for low-mass, high-redshift systems.
Current usage metrics show cumulative count of Article Views (full-text article views including HTML views, PDF and ePub downloads, according to the available data) and Abstracts Views on Vision4Press platform.
Data correspond to usage on the plateform after 2015. The current usage metrics is available 48-96 hours after online publication and is updated daily on week days.
Initial download of the metrics may take a while.