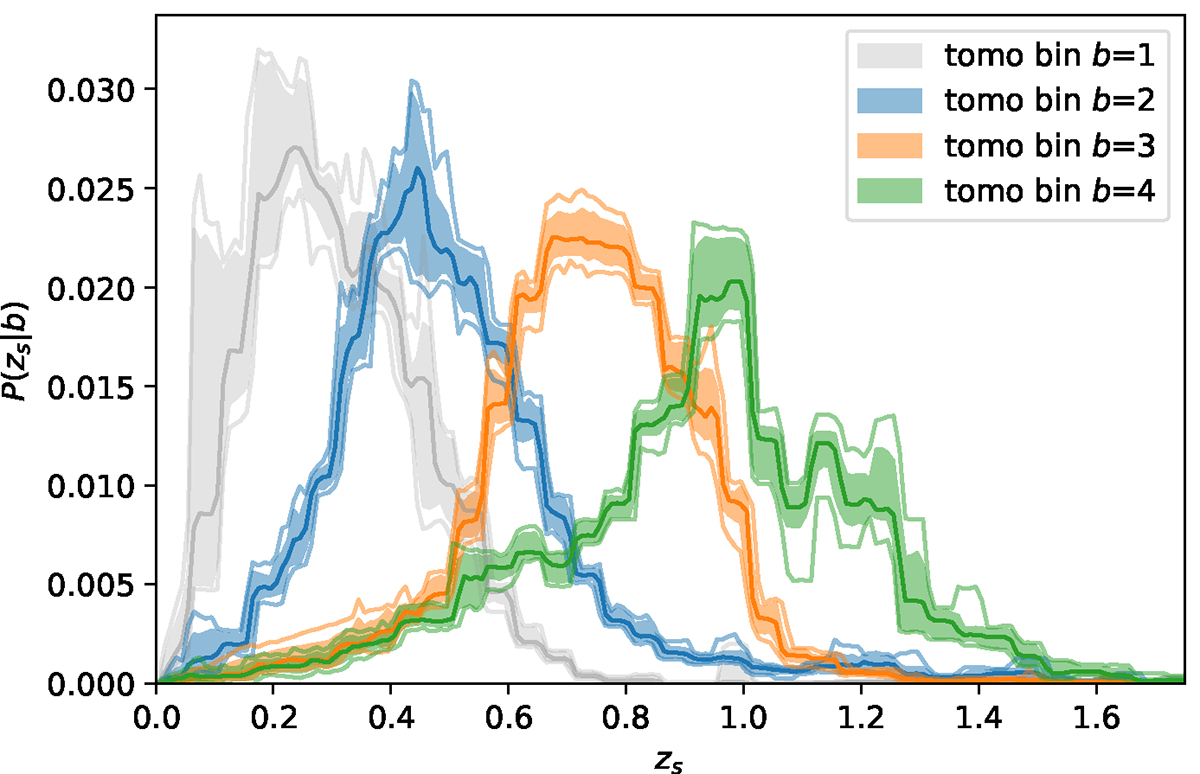
Fig. 2.
Download original image
Source redshift distributions of the tomographic redshift bin of the DES Y3 data. We plot the mean of the 1000 realizations (full line), together with the 16–84 percentile (filled region) and the 2.5–97.5 percentile (faded lines). The first tomographic bin is not used, while the others are weighted to ensure a lens-dependent background selection.
Current usage metrics show cumulative count of Article Views (full-text article views including HTML views, PDF and ePub downloads, according to the available data) and Abstracts Views on Vision4Press platform.
Data correspond to usage on the plateform after 2015. The current usage metrics is available 48-96 hours after online publication and is updated daily on week days.
Initial download of the metrics may take a while.