Fig. 3.
Download original image
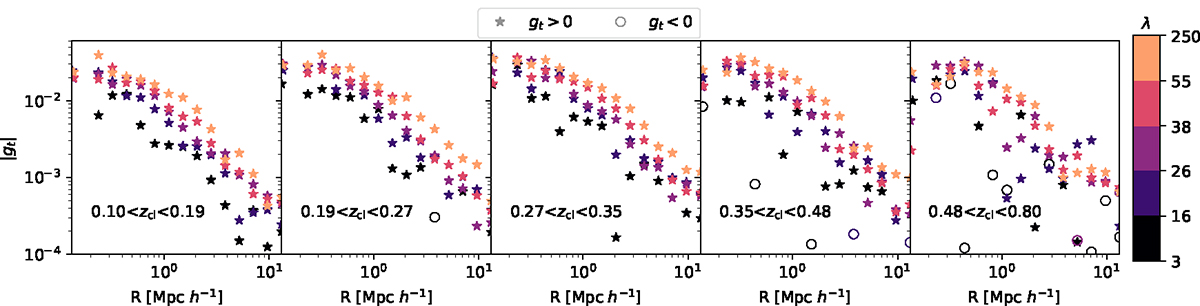
Absolute value of the raw tangential reduced shear profile, Eq. (8), in bins of cluster redshift (panels: lowest redshift left, higher redshift right) and of richness (color coding), for our background selection. Stars denote positive values, while empty circles denote negative values. The profiles show a clear increase toward the cluster centers, as well as a trend with richness, in line with our qualitative expectations.
Current usage metrics show cumulative count of Article Views (full-text article views including HTML views, PDF and ePub downloads, according to the available data) and Abstracts Views on Vision4Press platform.
Data correspond to usage on the plateform after 2015. The current usage metrics is available 48-96 hours after online publication and is updated daily on week days.
Initial download of the metrics may take a while.