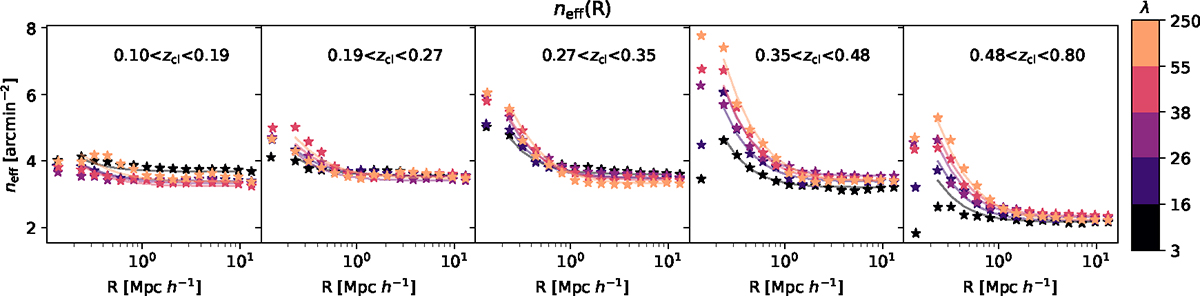
Fig. 4.
Download original image
Effective source density estimated from the effective number of source, Eq. (9), and the geometric area of the radial bins stacked in bins of cluster redshift (panels, lowest redshift left, higher redshift right) and of richness (color coding) as stars, for our background selection. Cluster members contaminating our background source sample leads to an increase of the effective source density toward the cluster center, which depends on both cluster richness and redshift. This signal needs to be determined, as cluster member contaminants are not sheared and dilute the shear estimator. Our model (lines) captures this trend well.
Current usage metrics show cumulative count of Article Views (full-text article views including HTML views, PDF and ePub downloads, according to the available data) and Abstracts Views on Vision4Press platform.
Data correspond to usage on the plateform after 2015. The current usage metrics is available 48-96 hours after online publication and is updated daily on week days.
Initial download of the metrics may take a while.