Fig. 5.
Download original image
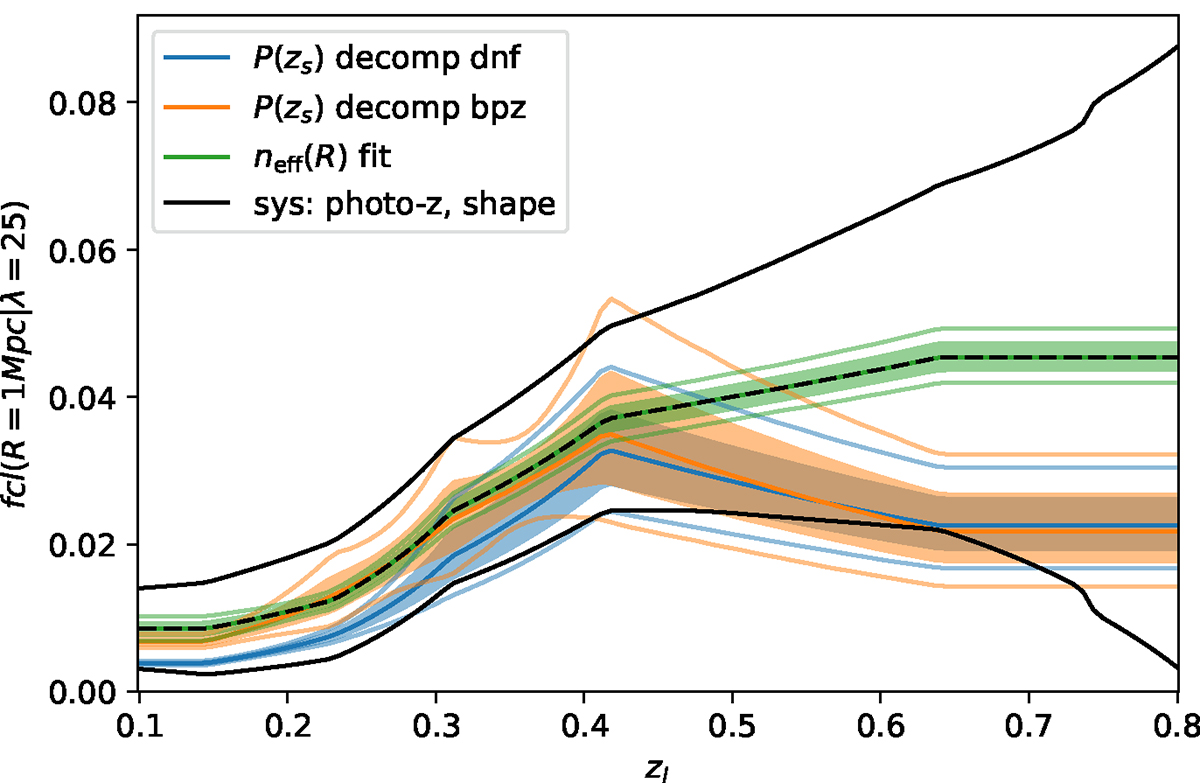
Cluster redshift trend of the cluster member contamination of a richness λ = 25 object at 1 Mpc from the cluster center. In green, the fit to the effective source number density, while in blue and orange, the constraints from the DNF and BPZ source redshift distribution decomposition are shown. The latter method is independent of masking. While we find marginal agreement between the contamination fractions determined by the two methods, the difference is smaller than the relative error induced by shape and photo-z systematics – plotted in black extending from the source density fit for comparison.
Current usage metrics show cumulative count of Article Views (full-text article views including HTML views, PDF and ePub downloads, according to the available data) and Abstracts Views on Vision4Press platform.
Data correspond to usage on the plateform after 2015. The current usage metrics is available 48-96 hours after online publication and is updated daily on week days.
Initial download of the metrics may take a while.