Fig. 6.
Download original image
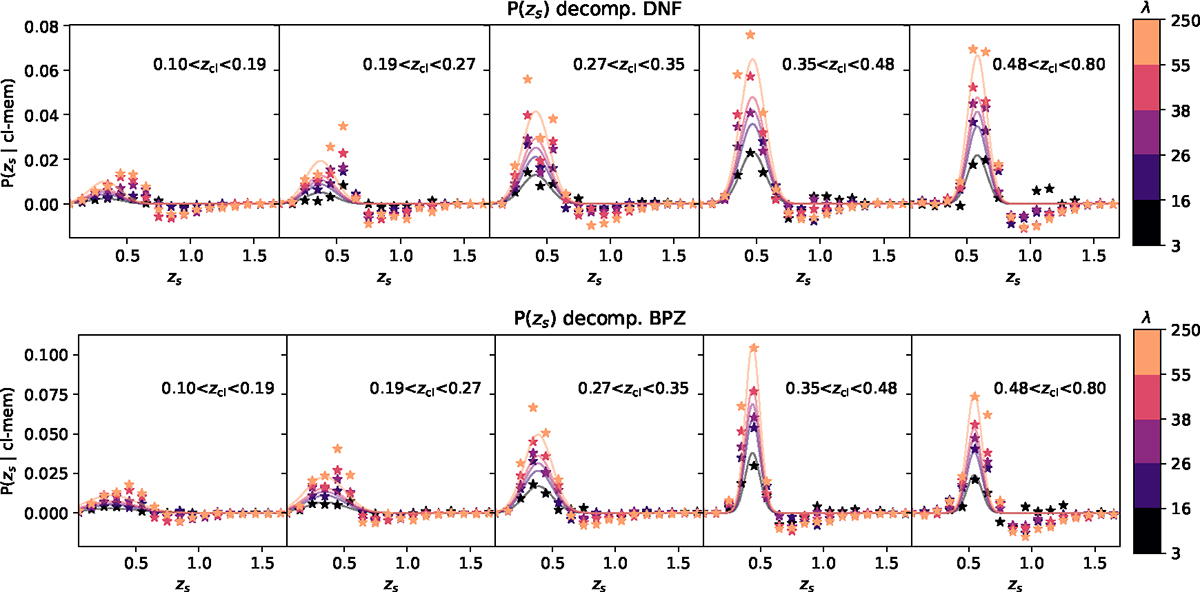
Validation of the source redshift distribution decomposition for DNF (top) and BPZ (bottom) source redshift estimates. In different richness (color coded) and redshift bins (different panels), we show the difference between the source redshift distribution measured along the cluster line of sights and the field distribution extracted at a safe distance from the cluster center, shown as stars. Both are shown here for the projected cluster-centric distance of 1 Mpc in our reference cosmology. The resulting increment is well modeled by a Gaussian component (lines) caused by the cluster members contaminating the source sample. The amplitude of this component scales with cluster richness.
Current usage metrics show cumulative count of Article Views (full-text article views including HTML views, PDF and ePub downloads, according to the available data) and Abstracts Views on Vision4Press platform.
Data correspond to usage on the plateform after 2015. The current usage metrics is available 48-96 hours after online publication and is updated daily on week days.
Initial download of the metrics may take a while.