Fig. 9.
Download original image
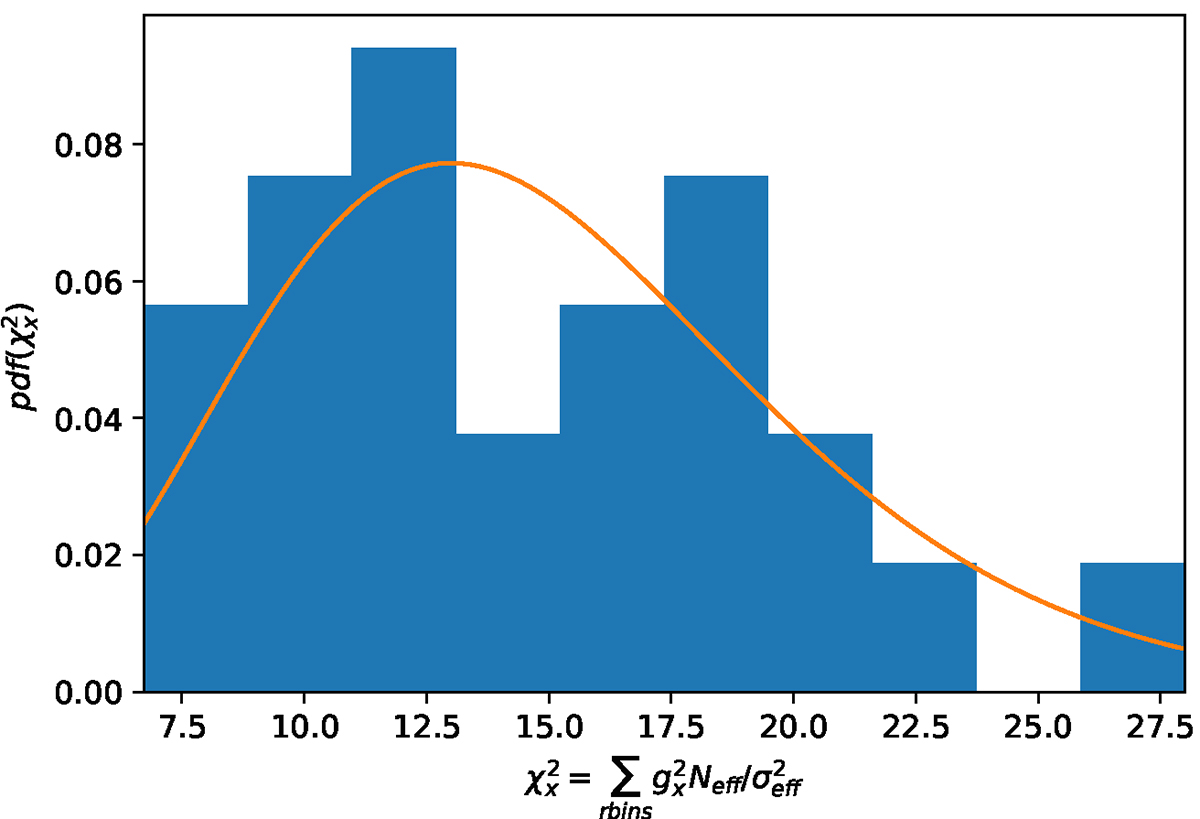
Distribution of the uncertainty-scaled squared residuals of the cross-shear profile with respect to zero signal, as a blue histogram. In orange, the chi-squared distribution for 15 degrees of freedom matches the number of radial bins. The squared loss distribution is well described by the chi-squared distribution, indicating that the cross-shear profiles are consistent with zero given our shape noise modeling.
Current usage metrics show cumulative count of Article Views (full-text article views including HTML views, PDF and ePub downloads, according to the available data) and Abstracts Views on Vision4Press platform.
Data correspond to usage on the plateform after 2015. The current usage metrics is available 48-96 hours after online publication and is updated daily on week days.
Initial download of the metrics may take a while.