Fig. 1.
Download original image
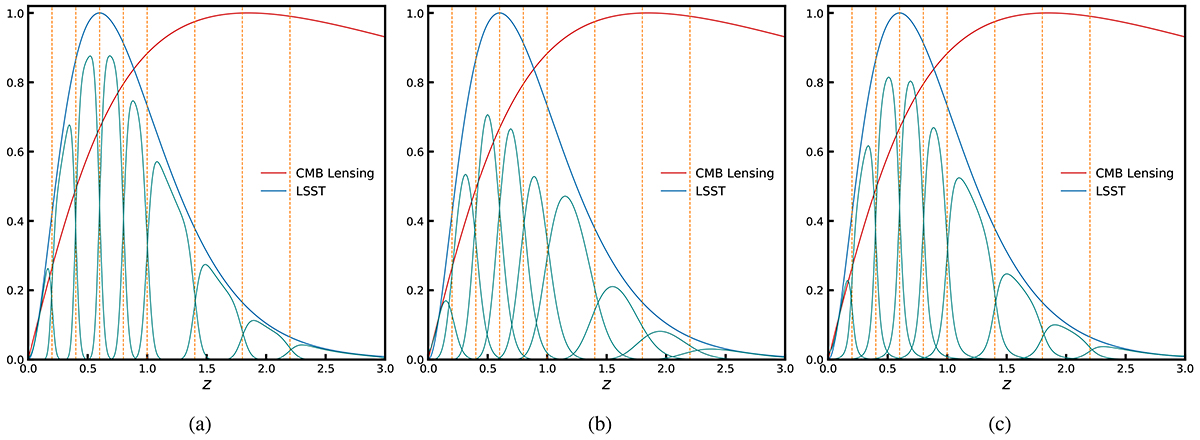
Effect of photometric redshift scatter on redshift distribution. True LSST redshift distribution (solid blue curve) divided into nine photometric redshift bins (shown by the solid green curves) for Gaussian redshift errors with (a) σ0 = 0.02, (b) σ0 = 0.05, and (c) for modified Lorentzian redshift errors with γ0 = 0.02. The red line denotes the CMB lensing kernel, and the dashed vertical orange lines mark the true redshift bins. The full LSST redshift distribution and CMB lensing kernel are normalised to unit maximum.
Current usage metrics show cumulative count of Article Views (full-text article views including HTML views, PDF and ePub downloads, according to the available data) and Abstracts Views on Vision4Press platform.
Data correspond to usage on the plateform after 2015. The current usage metrics is available 48-96 hours after online publication and is updated daily on week days.
Initial download of the metrics may take a while.