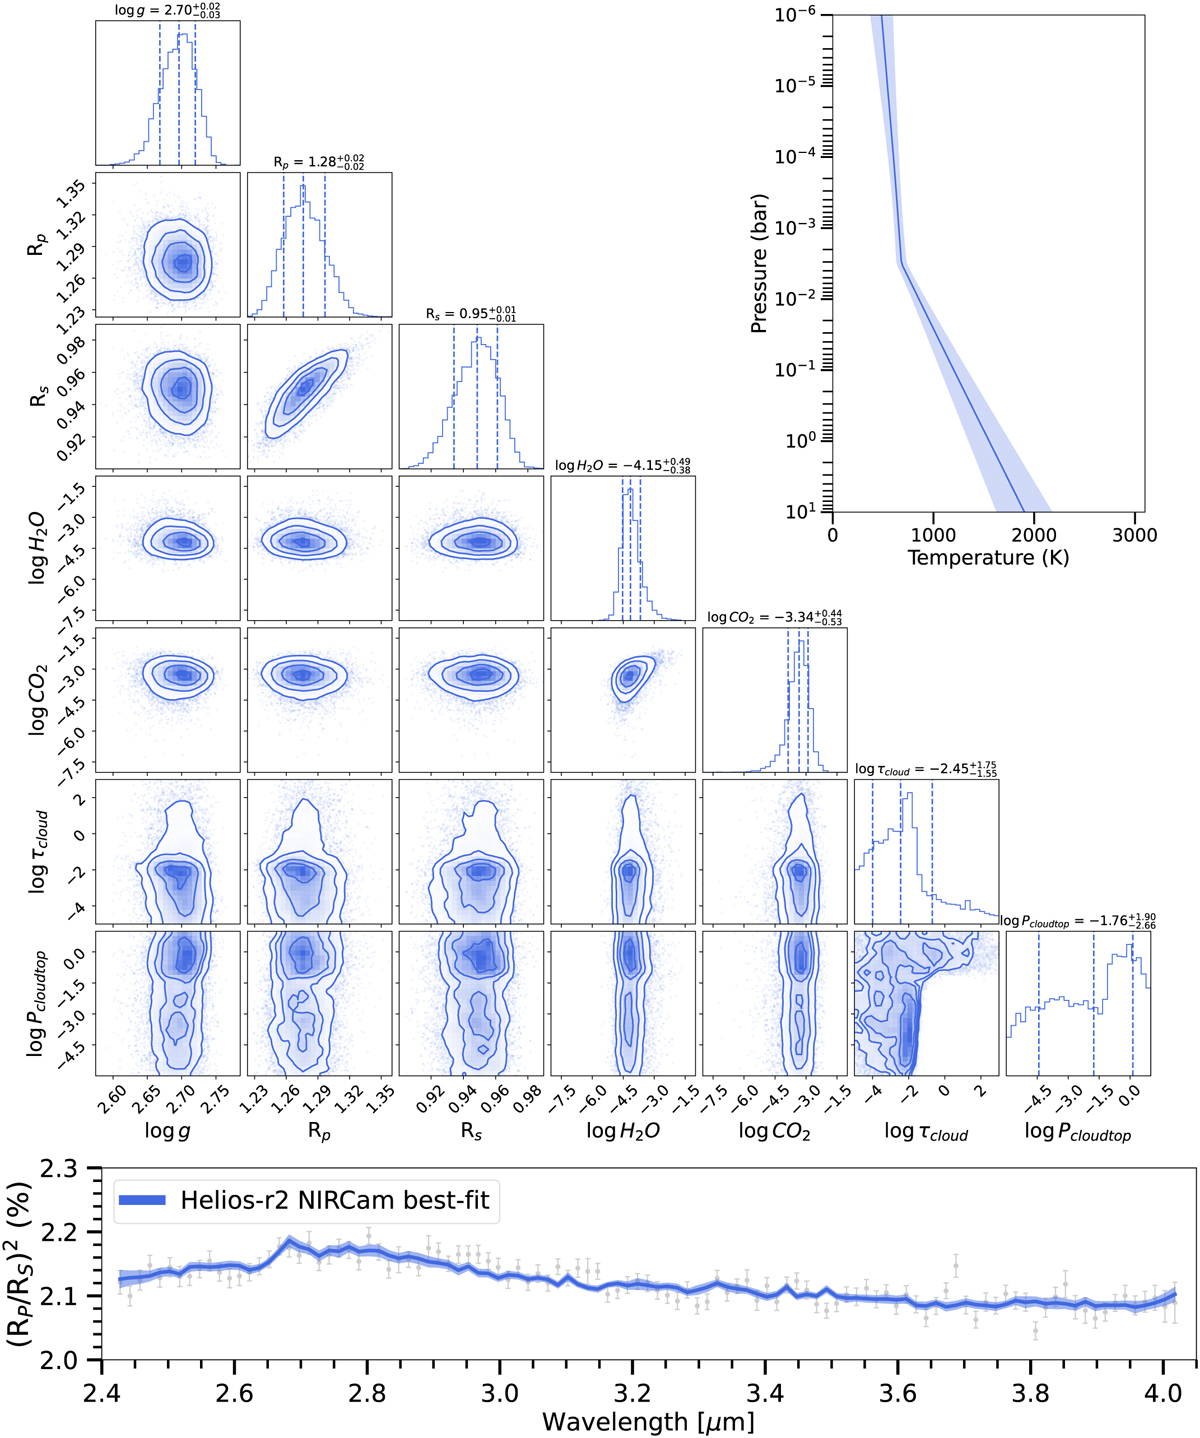
Fig. B.1
Download original image
Full set of posterior distributions from our nested sampling retrieval performed on the NIRCam spectrum. A simplified model assuming grey clouds was used. Relative to the model assuming non-grey clouds (see Fig. B.5), the logarithm of the Bayes factor is 0.41. For each marginalised posterior distribution, the vertical dashed lines indicate the median value of the distribution and the associated 1-σ uncertainties. The temperature-pressure profile also displays median values and the associated 1-σ uncertainties. The best-fit spectrum is associated with 1-σ uncertainties as well.
Current usage metrics show cumulative count of Article Views (full-text article views including HTML views, PDF and ePub downloads, according to the available data) and Abstracts Views on Vision4Press platform.
Data correspond to usage on the plateform after 2015. The current usage metrics is available 48-96 hours after online publication and is updated daily on week days.
Initial download of the metrics may take a while.