Open Access
Fig. 1.
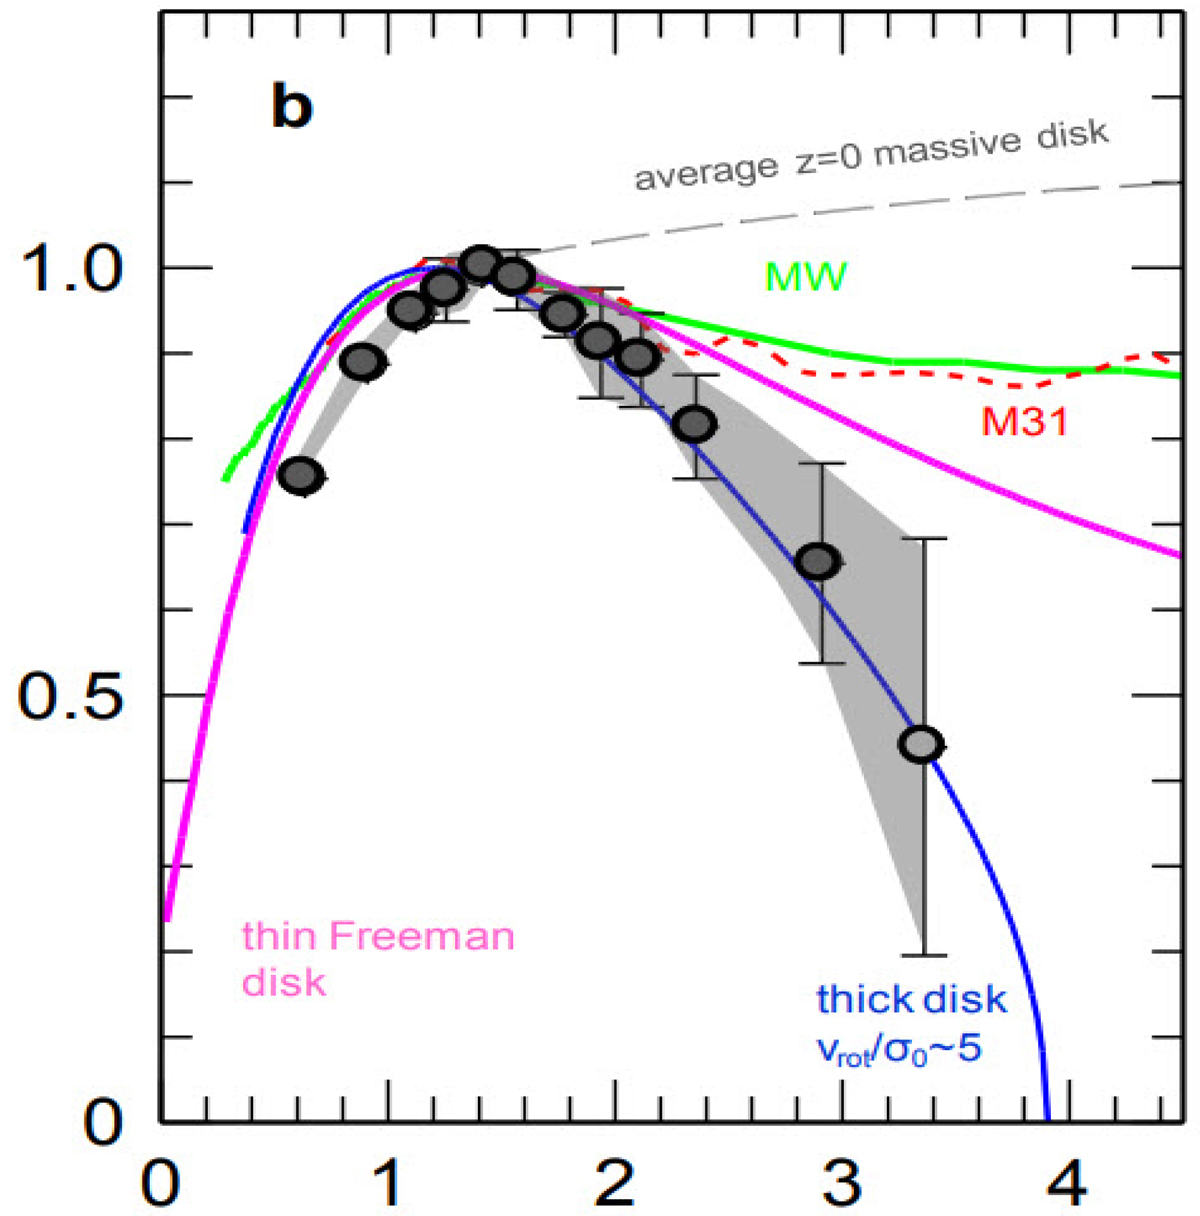
Download original image
Rotation curve, V/Vmax versus R/R1/2, obtained from a stack of distant galaxies (black dots with error bars) compared to the rotation curve of M31 (red broken line) and the Milky Way (green line) (Fig. 2b of Genzel et al. 2017).
Current usage metrics show cumulative count of Article Views (full-text article views including HTML views, PDF and ePub downloads, according to the available data) and Abstracts Views on Vision4Press platform.
Data correspond to usage on the plateform after 2015. The current usage metrics is available 48-96 hours after online publication and is updated daily on week days.
Initial download of the metrics may take a while.