Open Access
Fig. B.1
Download original image
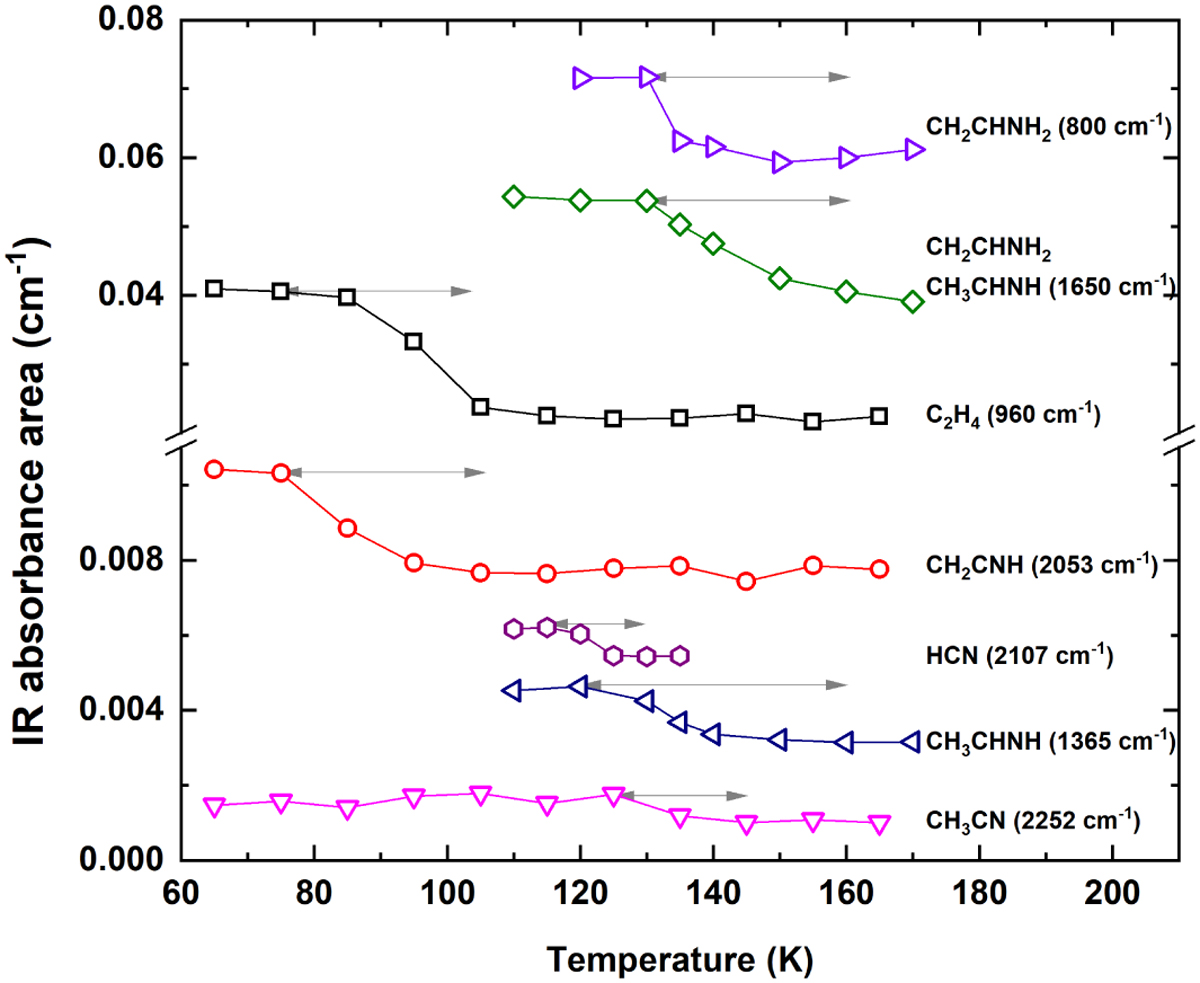
Kinetic evolution of the selected products as a function of temperature during the TPD experiment. The IR peaks used for monitoring the corresponding species are shown in parentheses. The arrows highlight the temperature range of desorption.
Current usage metrics show cumulative count of Article Views (full-text article views including HTML views, PDF and ePub downloads, according to the available data) and Abstracts Views on Vision4Press platform.
Data correspond to usage on the plateform after 2015. The current usage metrics is available 48-96 hours after online publication and is updated daily on week days.
Initial download of the metrics may take a while.