Fig. 3.
Download original image
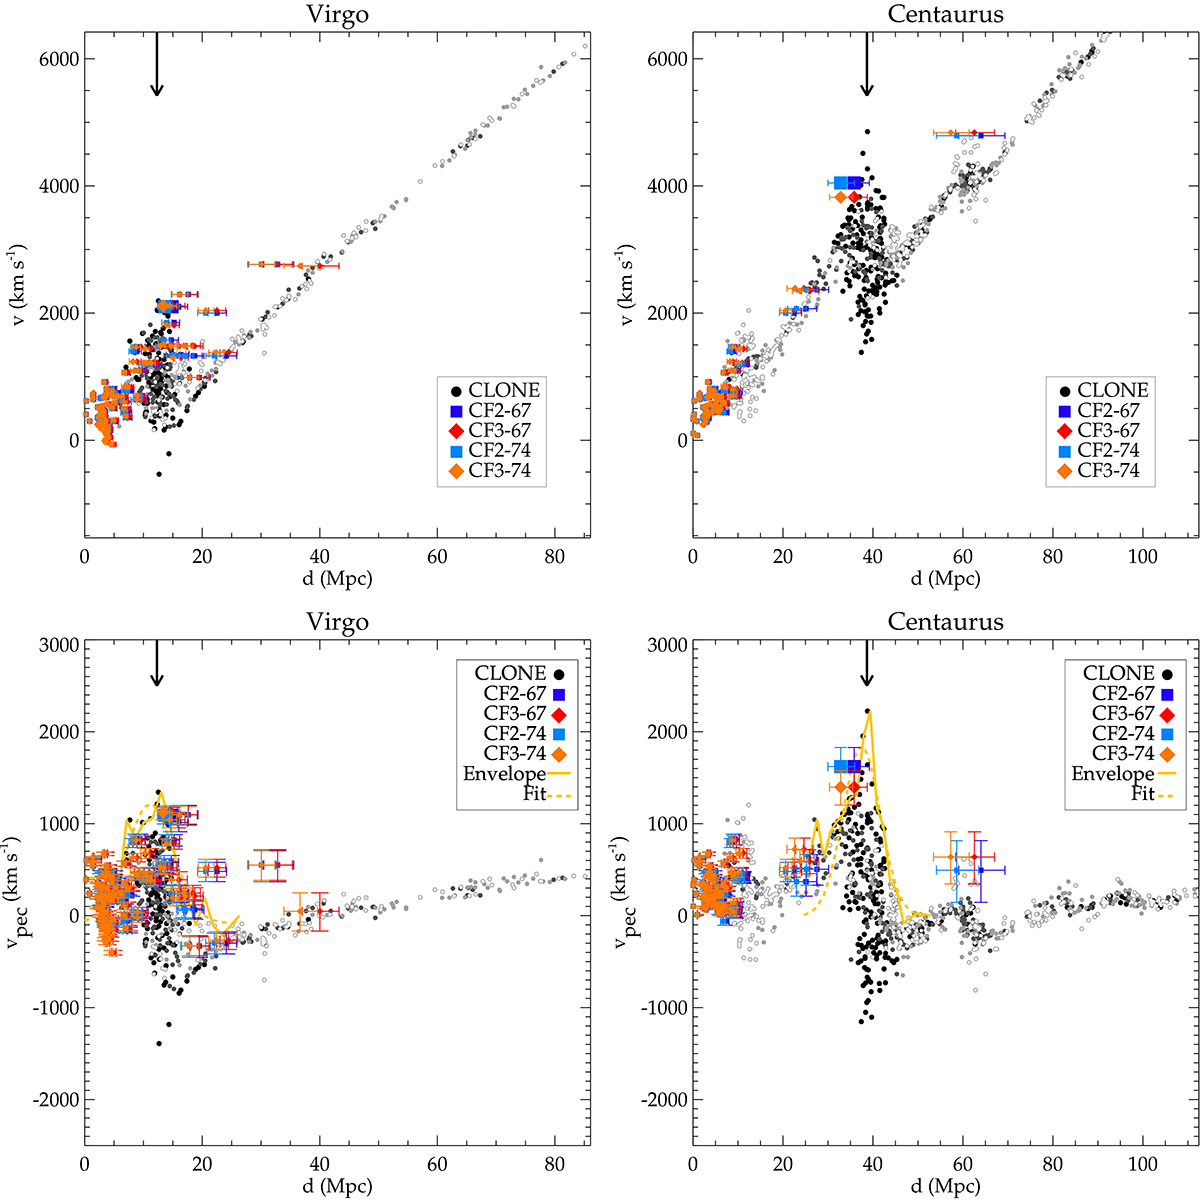
Radial velocities of simulated dark matter (sub)halos (black and grey) and observed galaxies (orange, blue, and red) as a function of the distance from the synthetic observer and us, respectively. Error bars stand for uncertainties on observational distance and velocity estimates. Orange and light blue (red and dark blue) filled squares and diamonds show observed galaxies, assuming H0 = 74 (67.77) km s−1 Mpc−1 for scaling positions. CF2 (CF3) corresponds to the second (third) catalog of the Cosmicflows project. Larger symbols are used for galaxies with a peculiar velocity higher than 1000 km s−1, identified as the closest to the simulated massive halos, assuming the synthetic observer at the box centre and the same supergalactic coordinate system and orientation as the local Universe. The arrow indicates the position of the massive dark matter halo in the simulation. Names of corresponding observed clusters are given at the top of each panel. Velocity waves stand out in the different lines of sight and there is a nice agreement with observational data points for those two best-constrained clusters, the closest to us. Top: Hubble diagram. Bottom: Hubble flow subtracted in the observations (H0 = 74 km s−1 Mpc−1; see the text for explanation on the zero point choice of the observational catalog) and not added in the simulation. The solid and dashed yellow lines are, respectively, the simulated positive-half velocity wave envelope and its Gaussian-plus-continuum fit. The colour scale filling the black circles stands for their distance from the line of sight. From black to light grey, objects are less than 2.5, 5, 7.5, and 10 Mpc away from the line of sight. The dark matter halo virial masses in the simulation are M = 9.8 × 10¹⁴ M⊙ and M = 9.0 × 10¹⁴ M⊙ for the Virgo and Centaurus cluster counterparts, respectively.
Current usage metrics show cumulative count of Article Views (full-text article views including HTML views, PDF and ePub downloads, according to the available data) and Abstracts Views on Vision4Press platform.
Data correspond to usage on the plateform after 2015. The current usage metrics is available 48-96 hours after online publication and is updated daily on week days.
Initial download of the metrics may take a while.