Fig. 8.
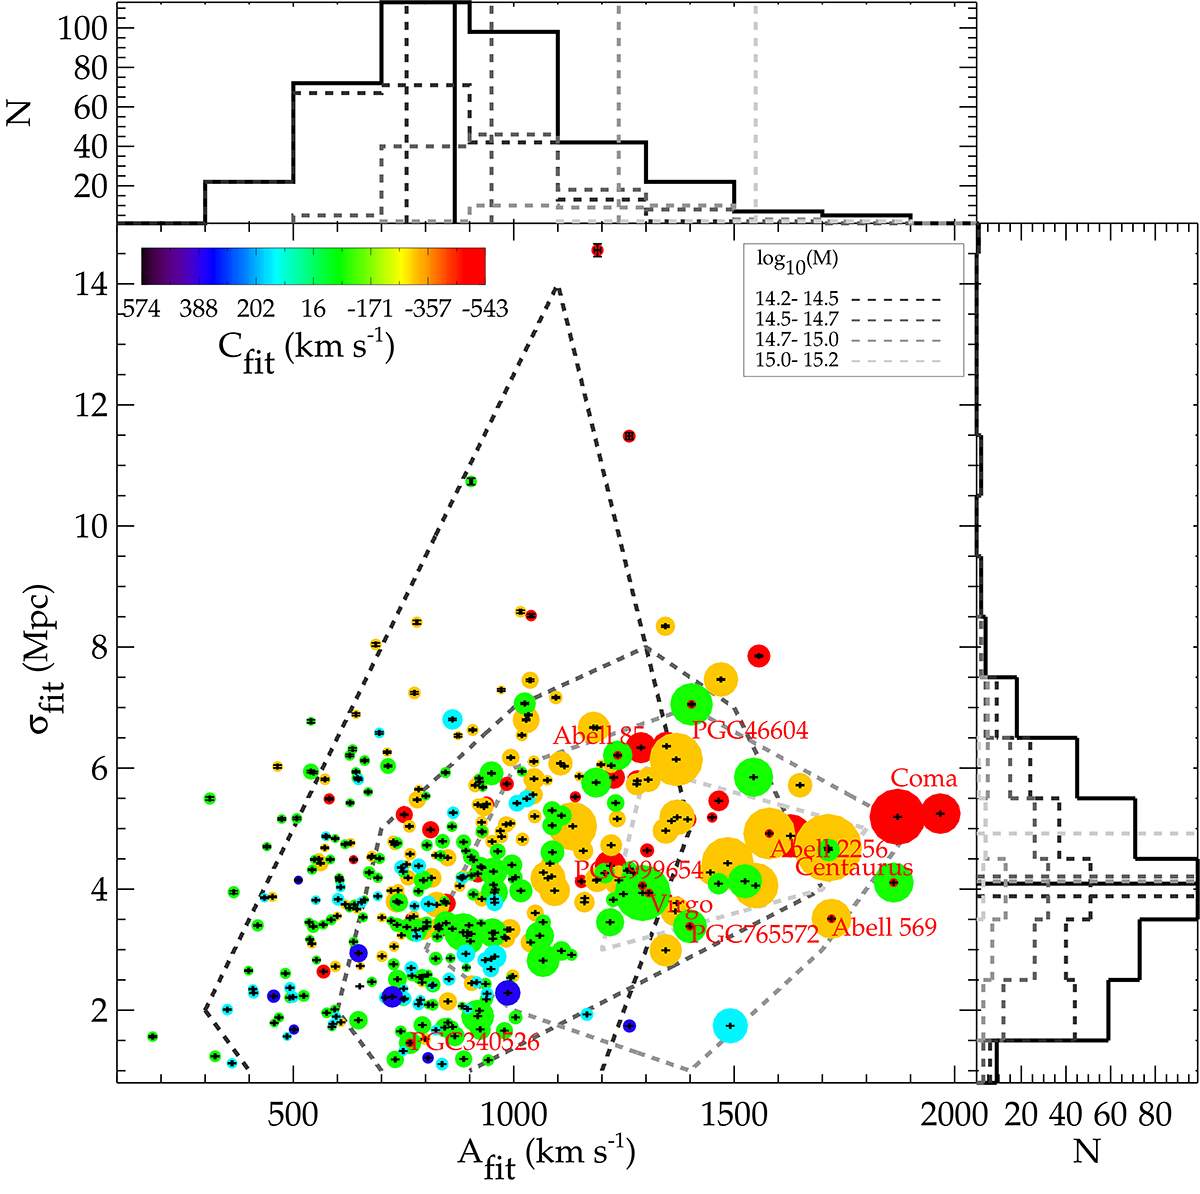
Download original image
Parameters of the Gaussian-plus-continuum fit to the simulated positive-half velocity waves. σfit stands for the Gaussian standard deviation, Afit for its amplitude, and Cfit for the continuum. The filled circle sizes are proportional to dark matter halo masses. Tiny error bars on the standard deviation and amplitude resulting from fitting the envelopes highlight the adequacy of the model choice. Halos shown in Figs. 3–5 are identified with red name tags and additional small filled red circles. The dashed grey lines stand for the surfaces that encompass 95% of the halos of a given mass bin. The mass bin increases from dark to light grey. Histograms of the amplitude and standard deviation values for the full sample of halos (solid black line) and per bin of mass (dashed grey lines) are given in the top and right panels, respectively, together with medians. The more massive the halos are the larger the amplitude is, and to a lesser extent the standard deviation is, on average. The scatter in the standard deviation values increases with the decrease in mass, probably because the environment plays a more important role for the halos of the smallest mass bin, while massive halos are more active in shaping their environment.
Current usage metrics show cumulative count of Article Views (full-text article views including HTML views, PDF and ePub downloads, according to the available data) and Abstracts Views on Vision4Press platform.
Data correspond to usage on the plateform after 2015. The current usage metrics is available 48-96 hours after online publication and is updated daily on week days.
Initial download of the metrics may take a while.