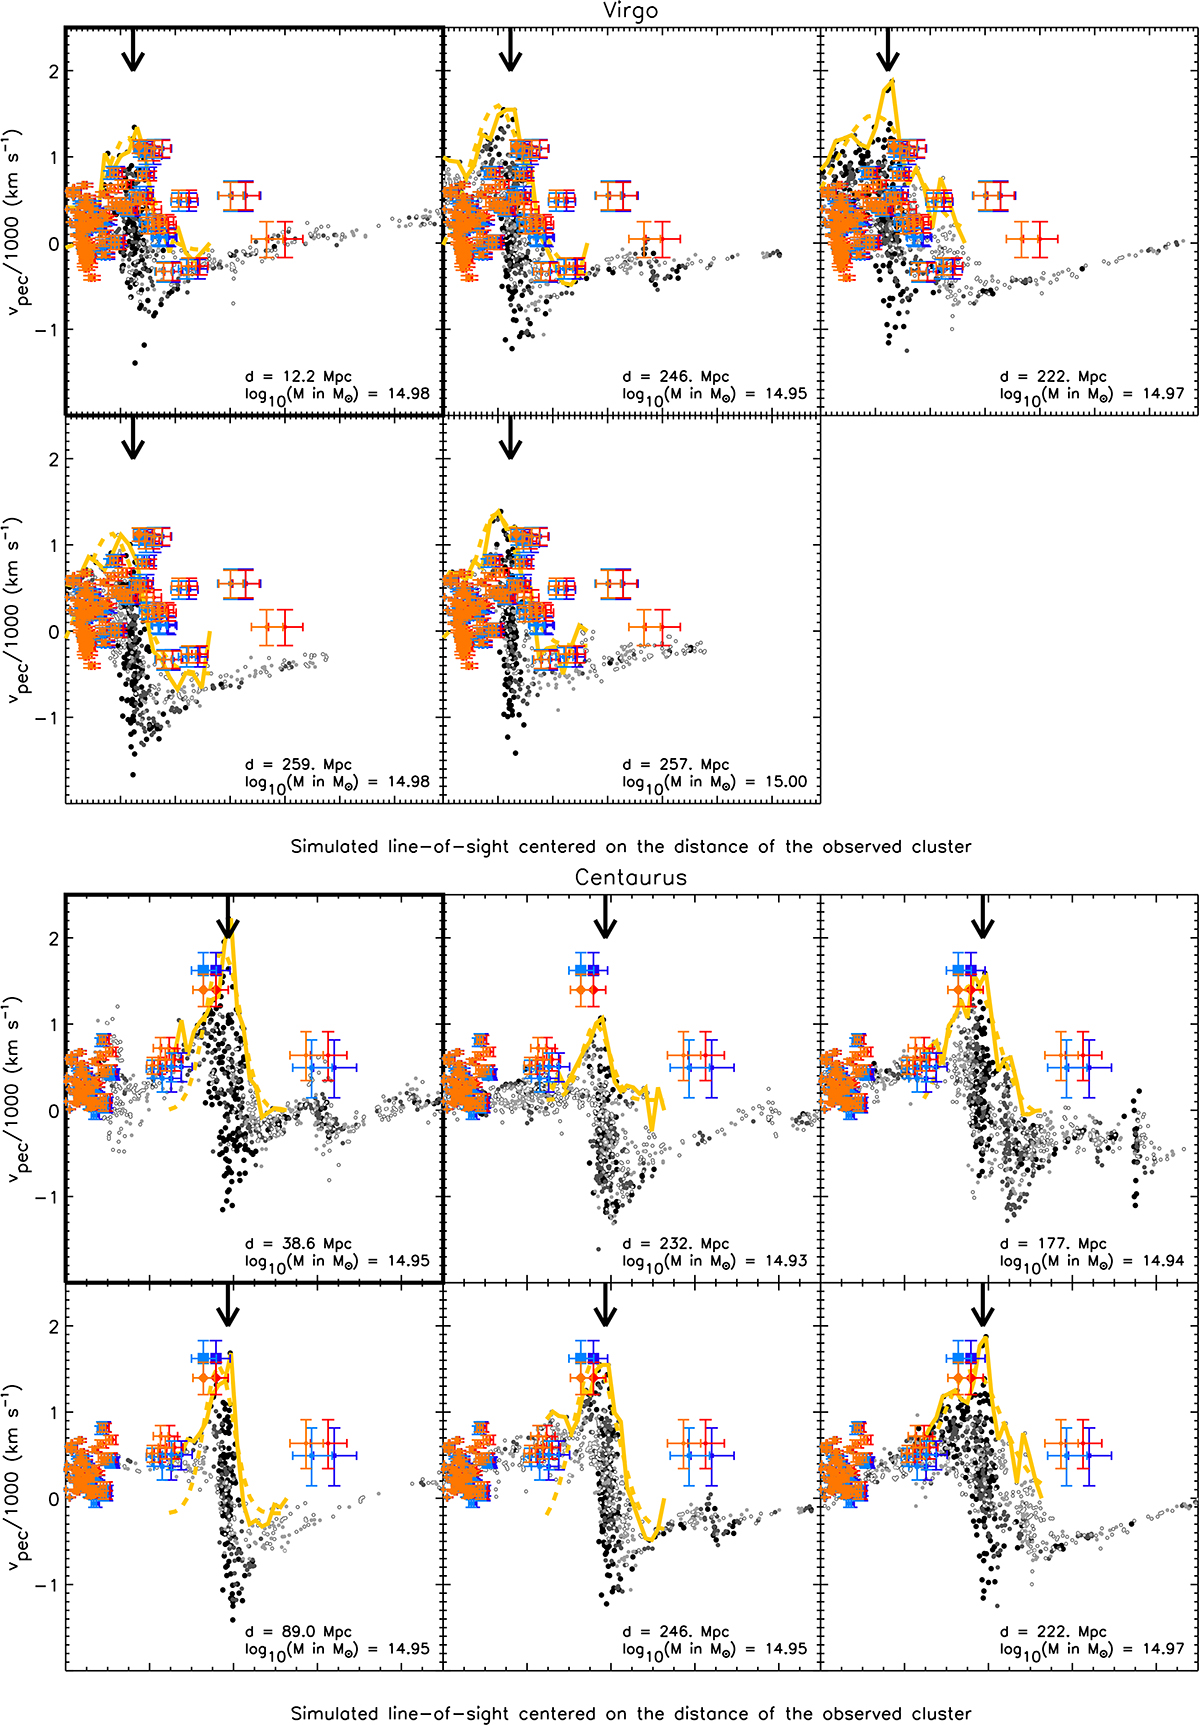
Fig. 9.
Download original image
Same as the bottom panels in Fig. 3, with additional comparisons with other halos sharing similar masses but different environments and histories. The first panel of each subfigure stands for the line of sight that includes the replica of the observed cluster whose name is given at the top of the panel. The other panels show the lines of sight that include halos with very similar masses to the replicas. They have been shifted, though, to be located at the same distance as the simulated replicas, in order to be able to overplot observational data points. Their original distance to the observer in the simulation is given together with their mass in each panel.
Current usage metrics show cumulative count of Article Views (full-text article views including HTML views, PDF and ePub downloads, according to the available data) and Abstracts Views on Vision4Press platform.
Data correspond to usage on the plateform after 2015. The current usage metrics is available 48-96 hours after online publication and is updated daily on week days.
Initial download of the metrics may take a while.