Fig. 4
Download original image
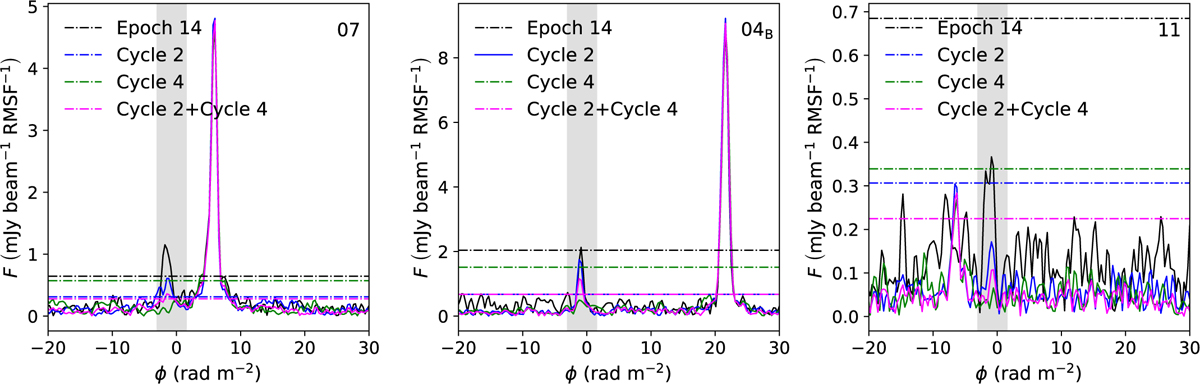
Faraday spectra of three sources: the reference source (source 07, left panel); the brightest polarized source component (04B, middle panel), and a faint source detected only after stacking data from both cycles (source 11, right panel). The displayed Faraday spectra are from the reference epoch (Epoch 014), from stacked Cycle 2, stacked Cycle 4, and combining both cycles. The gray region outlines the range in Faraday depth that was excluded from the analysis due to instrumental polarization. The horizontal lines indicate the corresponding 8σQU levels. Stacking reduces the noise levels (as shown by the magenta horizontal lines that are lowest). The data were of higher quality in Cycle 2 than in Cycle 4 (the horizontal blue lines are below the green ones).
Current usage metrics show cumulative count of Article Views (full-text article views including HTML views, PDF and ePub downloads, according to the available data) and Abstracts Views on Vision4Press platform.
Data correspond to usage on the plateform after 2015. The current usage metrics is available 48-96 hours after online publication and is updated daily on week days.
Initial download of the metrics may take a while.