Fig. 10
Download original image
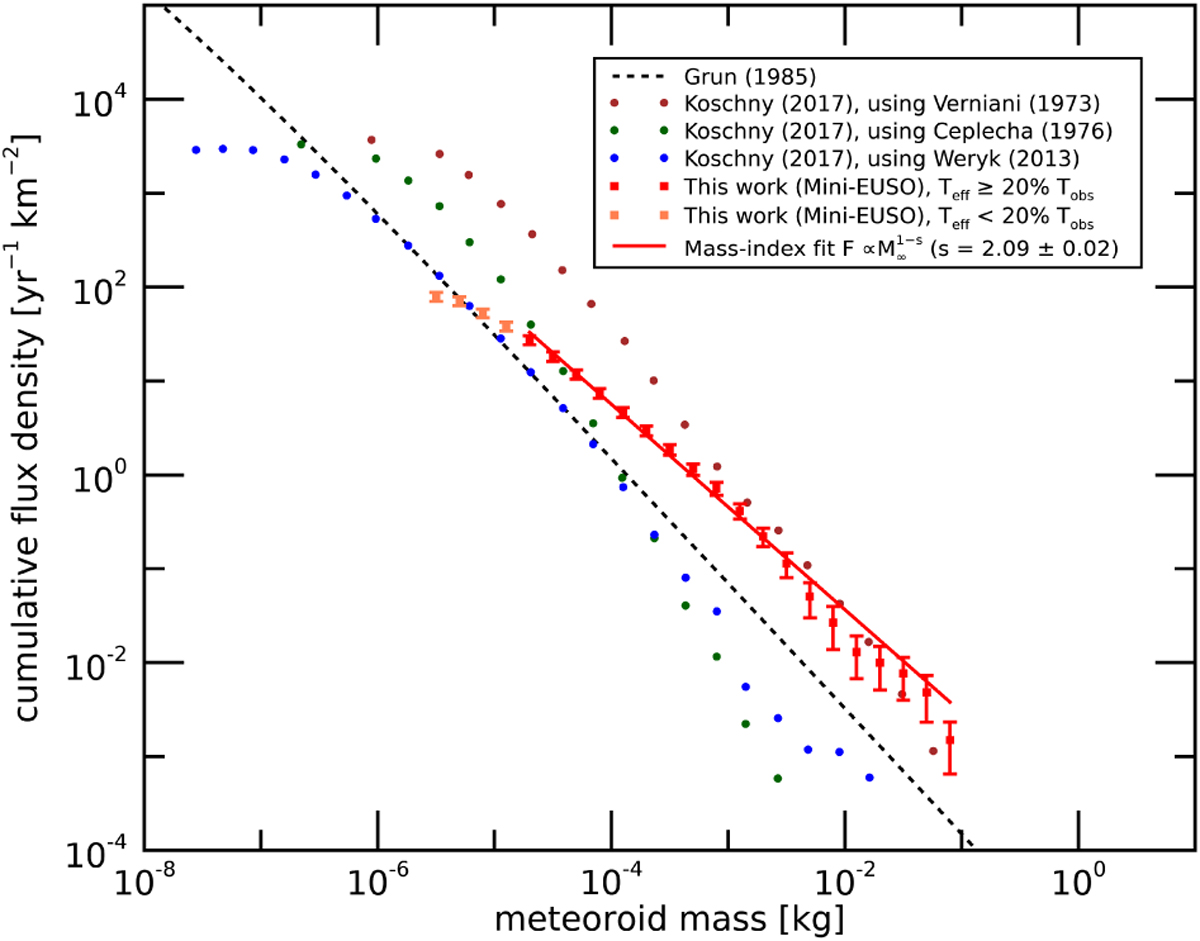
Cumulative flux density of meteors as a function of the preatmospheric mass of the meteoroid estimated from the observations of Mini-EUSO of sessions no. 05-44 (red squares with error bars), when assuming Eq. (12) for the conversion of the peak absolute magnitude to the pre-atmospheric mass of the meteoroid. Orange squares represent magnitude values ℳ ≥ +5 that are associated with an overall trigger efficiency ∊(ℳ) < 20%. The red thick lines plot the result of a linear fit in the log-log space to determine the mass-index of the distribution ![]() , which was estimated as s = 2.09 ± 0.02 from the Mini-EUSO data (see Sect. 5.1). As a comparison, the black dashed line plots the flux estimate of Grun et al. (1985) that was deduced from the study of micro-craters on returned lunar samples and from satellite measurements of micrometeoroid impacts. The three series of dots (brown, green, and blue) plot the results of Koschny et al. (2017), computed from the dataset of ~20 thousand double-station observations of meteors performed at the Canary Island Long-Baseline Observatory (CILBO) during a period of about 3.5 yr. Each series corresponds to a different method used by Koschny et al. (2017) to compute the pre-atmospheric mass from the absolute magnitude (Verniani 1973; Ceplecha & McCrosky 1976; Weryk & Brown 2013, see the legend in the figure adapted from Koschny et al. 2017).
, which was estimated as s = 2.09 ± 0.02 from the Mini-EUSO data (see Sect. 5.1). As a comparison, the black dashed line plots the flux estimate of Grun et al. (1985) that was deduced from the study of micro-craters on returned lunar samples and from satellite measurements of micrometeoroid impacts. The three series of dots (brown, green, and blue) plot the results of Koschny et al. (2017), computed from the dataset of ~20 thousand double-station observations of meteors performed at the Canary Island Long-Baseline Observatory (CILBO) during a period of about 3.5 yr. Each series corresponds to a different method used by Koschny et al. (2017) to compute the pre-atmospheric mass from the absolute magnitude (Verniani 1973; Ceplecha & McCrosky 1976; Weryk & Brown 2013, see the legend in the figure adapted from Koschny et al. 2017).
Current usage metrics show cumulative count of Article Views (full-text article views including HTML views, PDF and ePub downloads, according to the available data) and Abstracts Views on Vision4Press platform.
Data correspond to usage on the plateform after 2015. The current usage metrics is available 48-96 hours after online publication and is updated daily on week days.
Initial download of the metrics may take a while.