Fig. B.2
Download original image
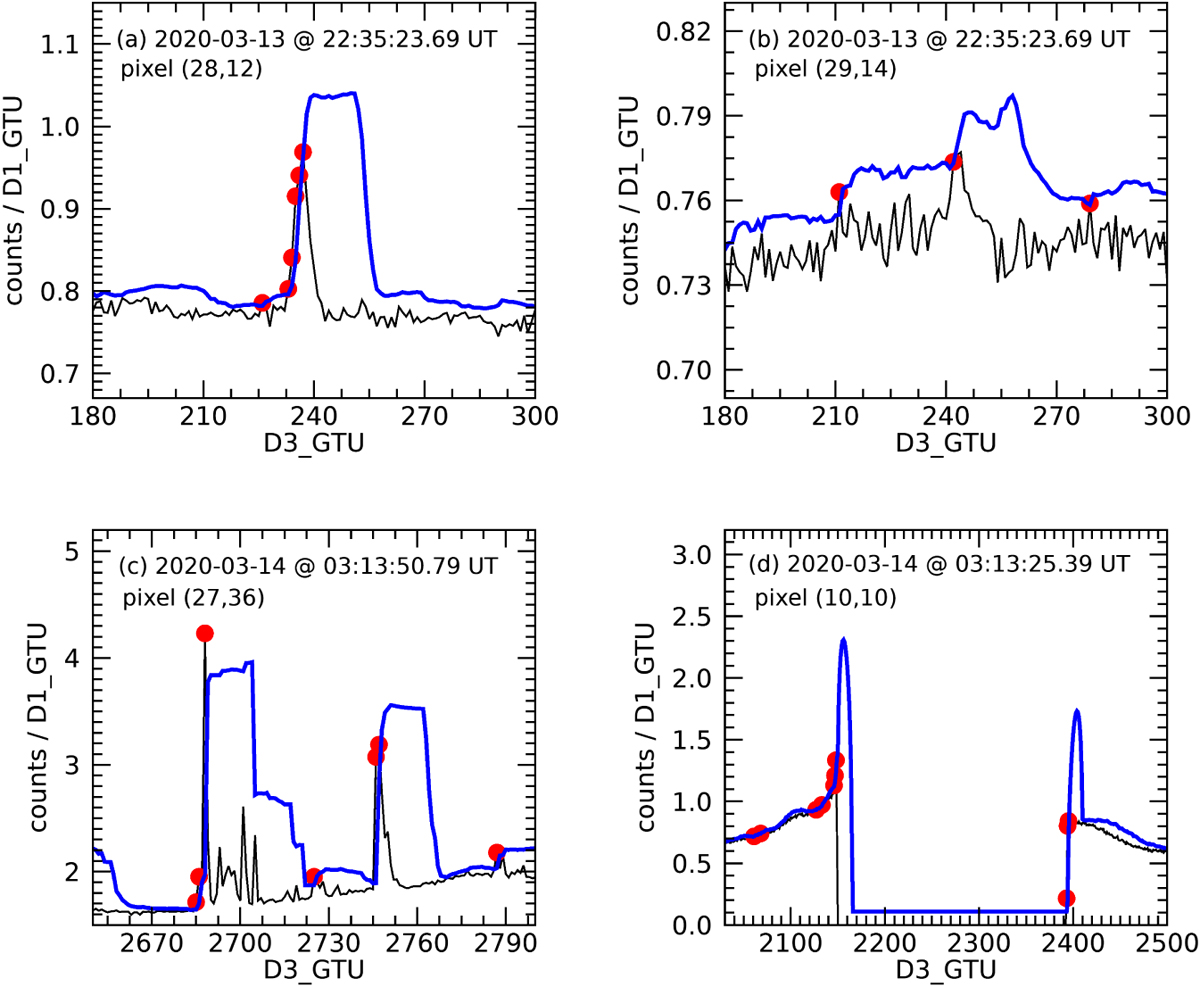
Four example cases of results from the Mini-EUSO meteor trigger 1 (Fig. B.1), from the data of session no. 13 (13-14/03/2020). In all sub-panels, the black curve plots the single-pixel light curve and the blue thick line plots the computed threshold according to the algorithm described in Sect. 3.1. Red points mark GTUs where the counts on the selected pixel exceed the given threshold. (a) Pixel light curve of a meteor event that exceeded the threshold on five consecutive GTUs and generated a trigger, whereas neighbouring isolated GTUs that happen to be over-threshold are discarded. (b) The signal of the same meteor of panel a that did not trigger because it was too faint, being recorded on the terminal pixel of the track. (c) Lightcurve of a thunderstorm imaged by Mini-EUS0. (d) Example of a cathode-2/3 transition.
Current usage metrics show cumulative count of Article Views (full-text article views including HTML views, PDF and ePub downloads, according to the available data) and Abstracts Views on Vision4Press platform.
Data correspond to usage on the plateform after 2015. The current usage metrics is available 48-96 hours after online publication and is updated daily on week days.
Initial download of the metrics may take a while.