Fig. C.1
Download original image
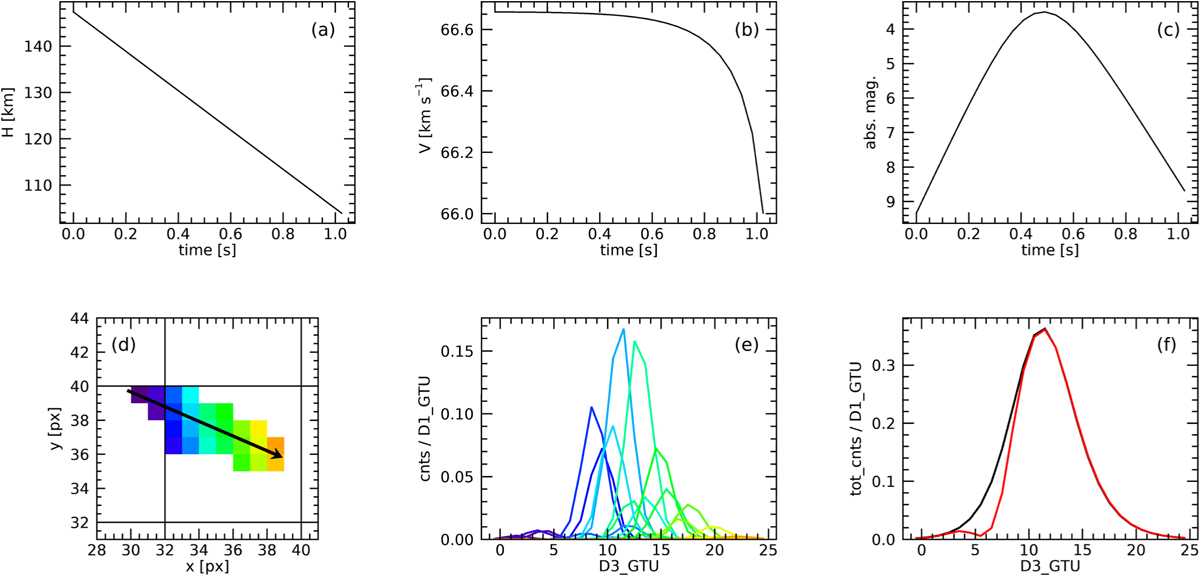
Example of simulated meteor of minimum absolute magnitude ℳ = +3.5 as seen by the Mini-EUSO telescope. The meteoroid had a pre-atmospheric mass of M∞ = 0.02 g and entered the atmosphere at V∞ = 66.6 km s−1 with an inclination angle of γ = 39.6°. (a) Altitude from the ground as a function of time; (b) speed module; (c) absolute magnitude light curve, peaking at +3.5; (d) map of pixels on the PDM that were crossed by the signal of the meteor; (e) single-pixel light curves with the colour code of panel d; (f) total integrated light curve (black curve, inverse of Eq. 7 from panel c) compared to the actual counts recorded on the PDM (red curve), which are lower in the first part of the event because the apparent path of the meteor crossed the corner between four MAPMTs.
Current usage metrics show cumulative count of Article Views (full-text article views including HTML views, PDF and ePub downloads, according to the available data) and Abstracts Views on Vision4Press platform.
Data correspond to usage on the plateform after 2015. The current usage metrics is available 48-96 hours after online publication and is updated daily on week days.
Initial download of the metrics may take a while.