Fig. 2
Download original image
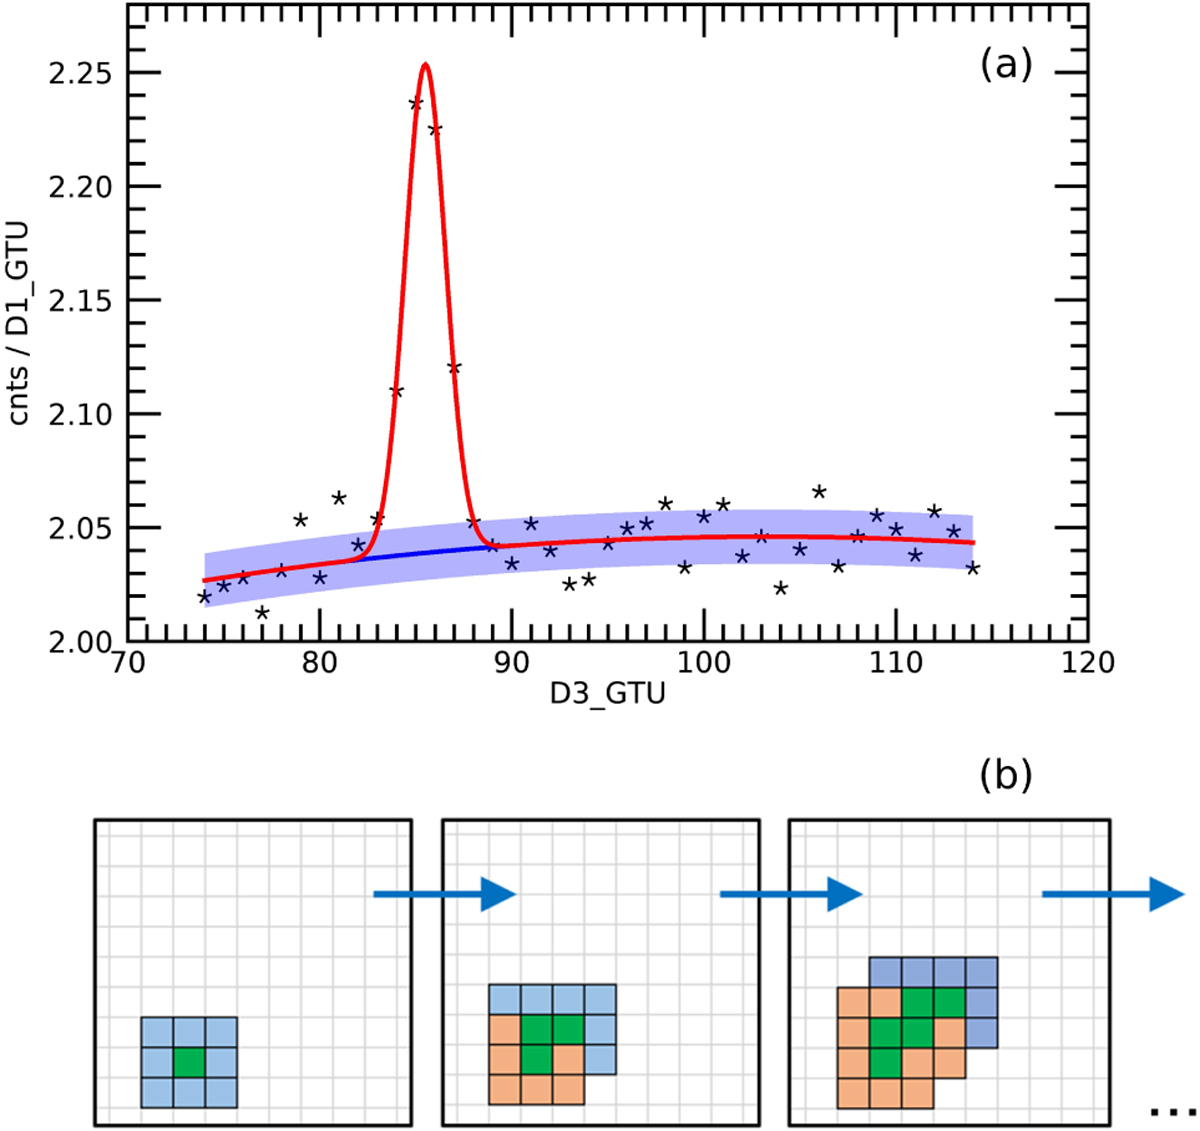
Schematisation of the tracking algorithm designed to reconstruct the meteor path imaged on the PDM of Mini-EUSO in D3 data. (a) Example of the fit of the Gaussian profile of Eq. (1) to identify the meteor signal. Black stars represent the measured light curve of the pixel, the red line is the fitted Gaussian function and the blue line and shaded band plot the background polynomial term with its 3σ confidence interval. (b) Graphical representation of the iterative process to identify all the pixels within the meteor track. We start from the first pixel provided by the trigger algorithm and evaluate its significance (green square in the first box from the left), then we add to the processing list all of its first neighbours (blue pixels), which are again evaluated by the fitting of panel a. Some of them will be discarded (orange pixels). Every time a new pixel is added to the track, all of its first neighbours are added to the processing list if they had not already been checked, until no more pixels are found to be significant.
Current usage metrics show cumulative count of Article Views (full-text article views including HTML views, PDF and ePub downloads, according to the available data) and Abstracts Views on Vision4Press platform.
Data correspond to usage on the plateform after 2015. The current usage metrics is available 48-96 hours after online publication and is updated daily on week days.
Initial download of the metrics may take a while.