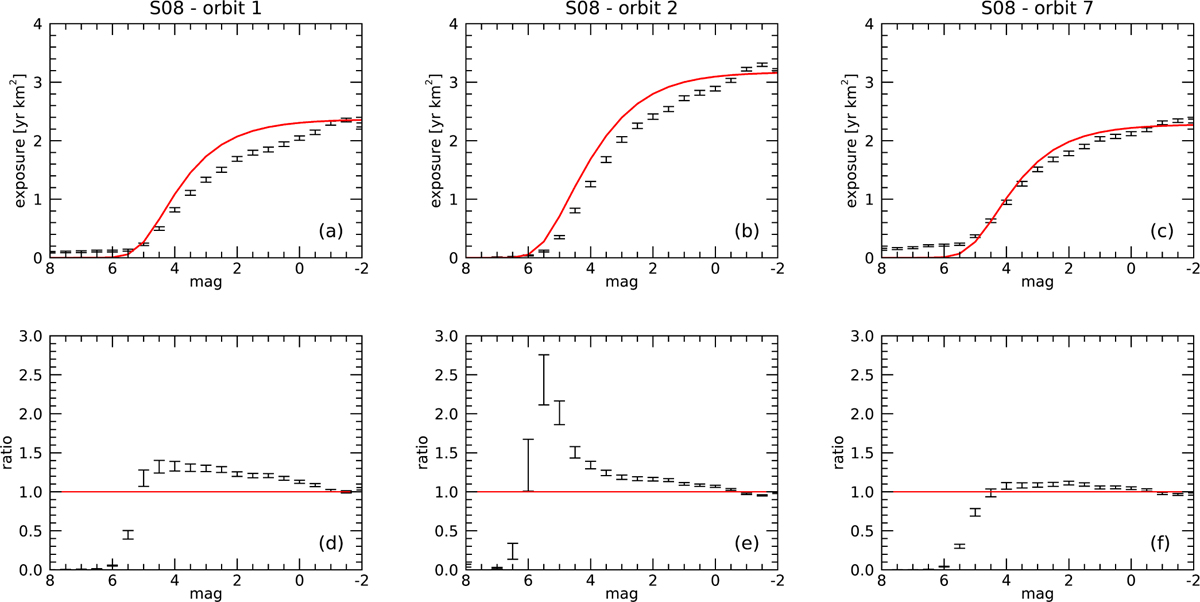
Fig. C.2
Download original image
Results of the comparison between two methods to compute the total exposure of the Mini-EUSO telescope, as applied to the observation of meteors in the magnitude range ℳ ∊ [−2, 8] for three ISS orbits during session no. 08 (30-31 December 2019). In all panels, the red curve plots the total exposure computed from the flat background assumption on each pixel (method 1, Eq. C.5), whereas the black dots with error bars are the results of the direct implementation of meteor simulations over the observed D3 data of this sessions, once all recorded meteors are artificially removed from the video (method 2). Panels a-c plot the comparison between methods 1 and 2 for orbits 1, 2, and 7 of session no. 08 and panels d-f report the ratio between the two methods (i.e. the factor that should be applied to the absolute flux of meteors if considering the exposure resulting from method 2 instead of method 1).
Current usage metrics show cumulative count of Article Views (full-text article views including HTML views, PDF and ePub downloads, according to the available data) and Abstracts Views on Vision4Press platform.
Data correspond to usage on the plateform after 2015. The current usage metrics is available 48-96 hours after online publication and is updated daily on week days.
Initial download of the metrics may take a while.