Fig. 3
Download original image
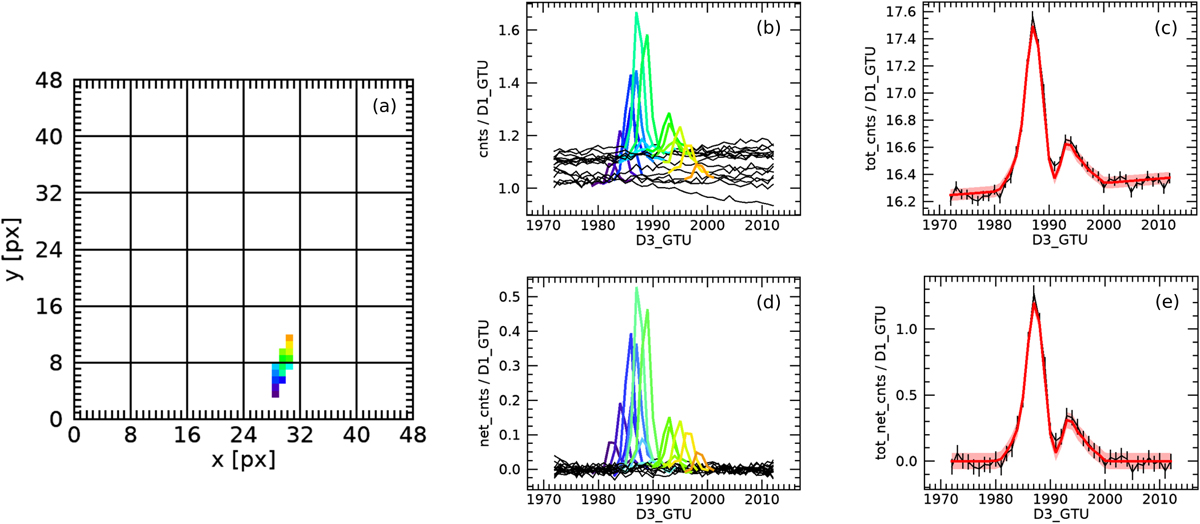
Results of the meteor tracking algorithm for one event of the Mini-EUSO session no. 11, occurred on 21/02/2020 at 20:05:55.15 UT over the Indian Ocean (20°56′ S, 93°56′ E). (a) Map of the identified pixel within the track on the PDM; (b) measured light curves of all the coloured pixels of panel a plotted with matching colours and highlighting the GTU range corresponding to the transit of the meteor projected on each individual pixel; (c) integral light curve obtained by summing the ones of panel b; (d) light curves of net counts of the meteor obtained according to Eq. (2); (e) integral net light curve. In its apparent motion, the meteor crosses the border between two MAPMTs, as evident from the decreased counts around GTU 1990 on the plots of panels c and e. In these panels, the red curves plot the total light curve derived from the fit results, namely, the Gaussian term of Eq. (1) summed over all the pixels in the track.
Current usage metrics show cumulative count of Article Views (full-text article views including HTML views, PDF and ePub downloads, according to the available data) and Abstracts Views on Vision4Press platform.
Data correspond to usage on the plateform after 2015. The current usage metrics is available 48-96 hours after online publication and is updated daily on week days.
Initial download of the metrics may take a while.