Fig. 4
Download original image
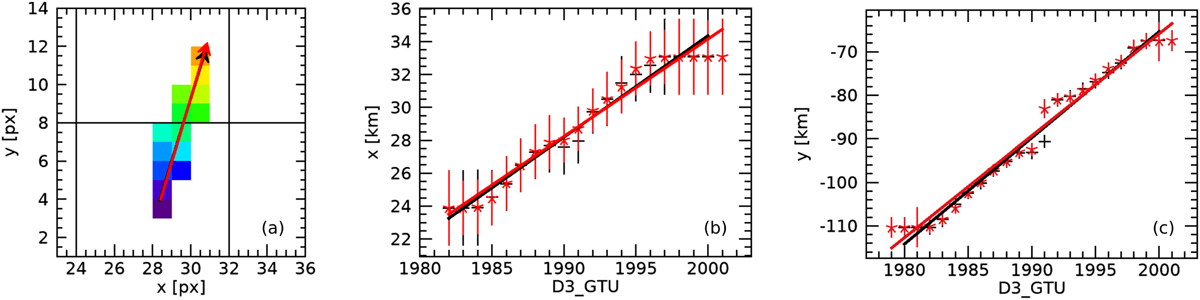
Results of the barycentre computation for the event presented in Fig. 3. In all panels, the black points and lines represent the results of the computation over the net measured counts ![]() , whereas the red ones are the results of the Gaussian fitting of Eq. (1) (as for Figs. 3c,e). During the analysis, both of these versions are computed for a consistency check and a posteriori verification of the goodness of the fit. In this case, the two results are completely overlapping. (a) Map of the pixels corresponding to the projected meteor track, with the arrow indicating the apparent motion direction on the PDM. (b) Barycentre x positions of the meteor from the FOV centre computed from Eq. (3) (dots with error bars) as a function of the GTU index and converted to km assuming an altitude of the meteor of H = 100 km from the ground level. The result of the linear fitting is plotted by the solid lines. (c) Same as panel b but for the y positions.
, whereas the red ones are the results of the Gaussian fitting of Eq. (1) (as for Figs. 3c,e). During the analysis, both of these versions are computed for a consistency check and a posteriori verification of the goodness of the fit. In this case, the two results are completely overlapping. (a) Map of the pixels corresponding to the projected meteor track, with the arrow indicating the apparent motion direction on the PDM. (b) Barycentre x positions of the meteor from the FOV centre computed from Eq. (3) (dots with error bars) as a function of the GTU index and converted to km assuming an altitude of the meteor of H = 100 km from the ground level. The result of the linear fitting is plotted by the solid lines. (c) Same as panel b but for the y positions.
Current usage metrics show cumulative count of Article Views (full-text article views including HTML views, PDF and ePub downloads, according to the available data) and Abstracts Views on Vision4Press platform.
Data correspond to usage on the plateform after 2015. The current usage metrics is available 48-96 hours after online publication and is updated daily on week days.
Initial download of the metrics may take a while.