Fig. 10
Download original image
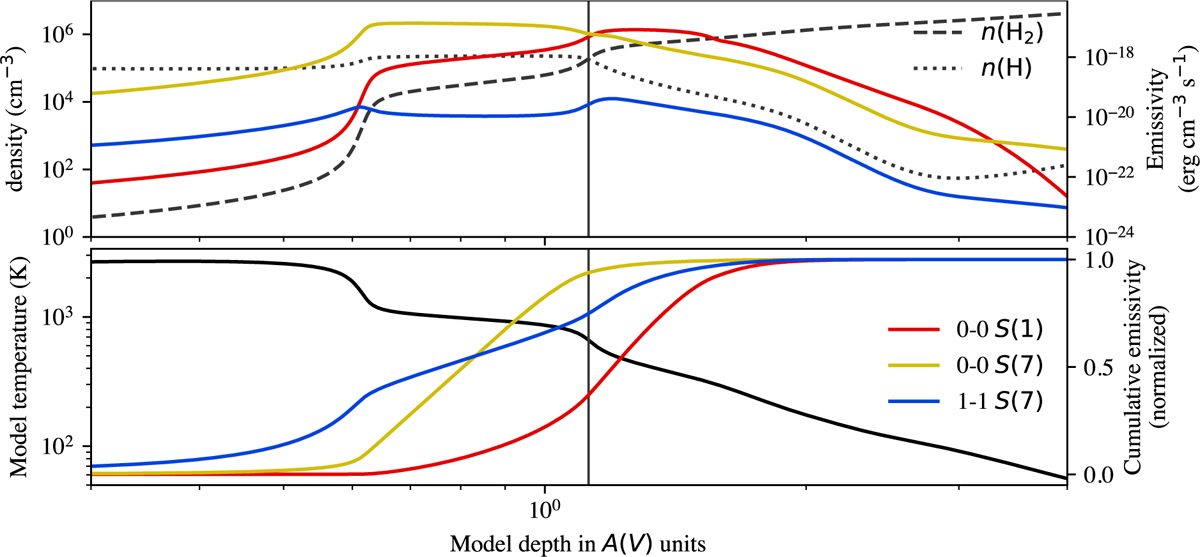
Top panel: structure of the HI/H2 transition predicted by Meudon model as function of depth. Densities of H and H2, with vertical line that indicates the transition defined as n(H) = n(H2). The local emissivity of each gas layer is shown for four representative H2 lines. Bottom panel: temperature and cumulative emissivity versus model depth. Black line and left y-axis: gas temperature for each layer in the model. Colorful lines and right y-axis: cumulative of the emissivity contributions by each layer (weighted by length scale). By inspecting the A(V) ranges over which the cumulative emissivity curves rise the most, we can see the typical range of gas temperatures from which the lines originate. For the 1–1 S (7) line for example, the observed excitation temperature is ~2700 K, while around 75% of the emission originates from gas cooler than 1000 K, due to UV pumping.
Current usage metrics show cumulative count of Article Views (full-text article views including HTML views, PDF and ePub downloads, according to the available data) and Abstracts Views on Vision4Press platform.
Data correspond to usage on the plateform after 2015. The current usage metrics is available 48-96 hours after online publication and is updated daily on week days.
Initial download of the metrics may take a while.