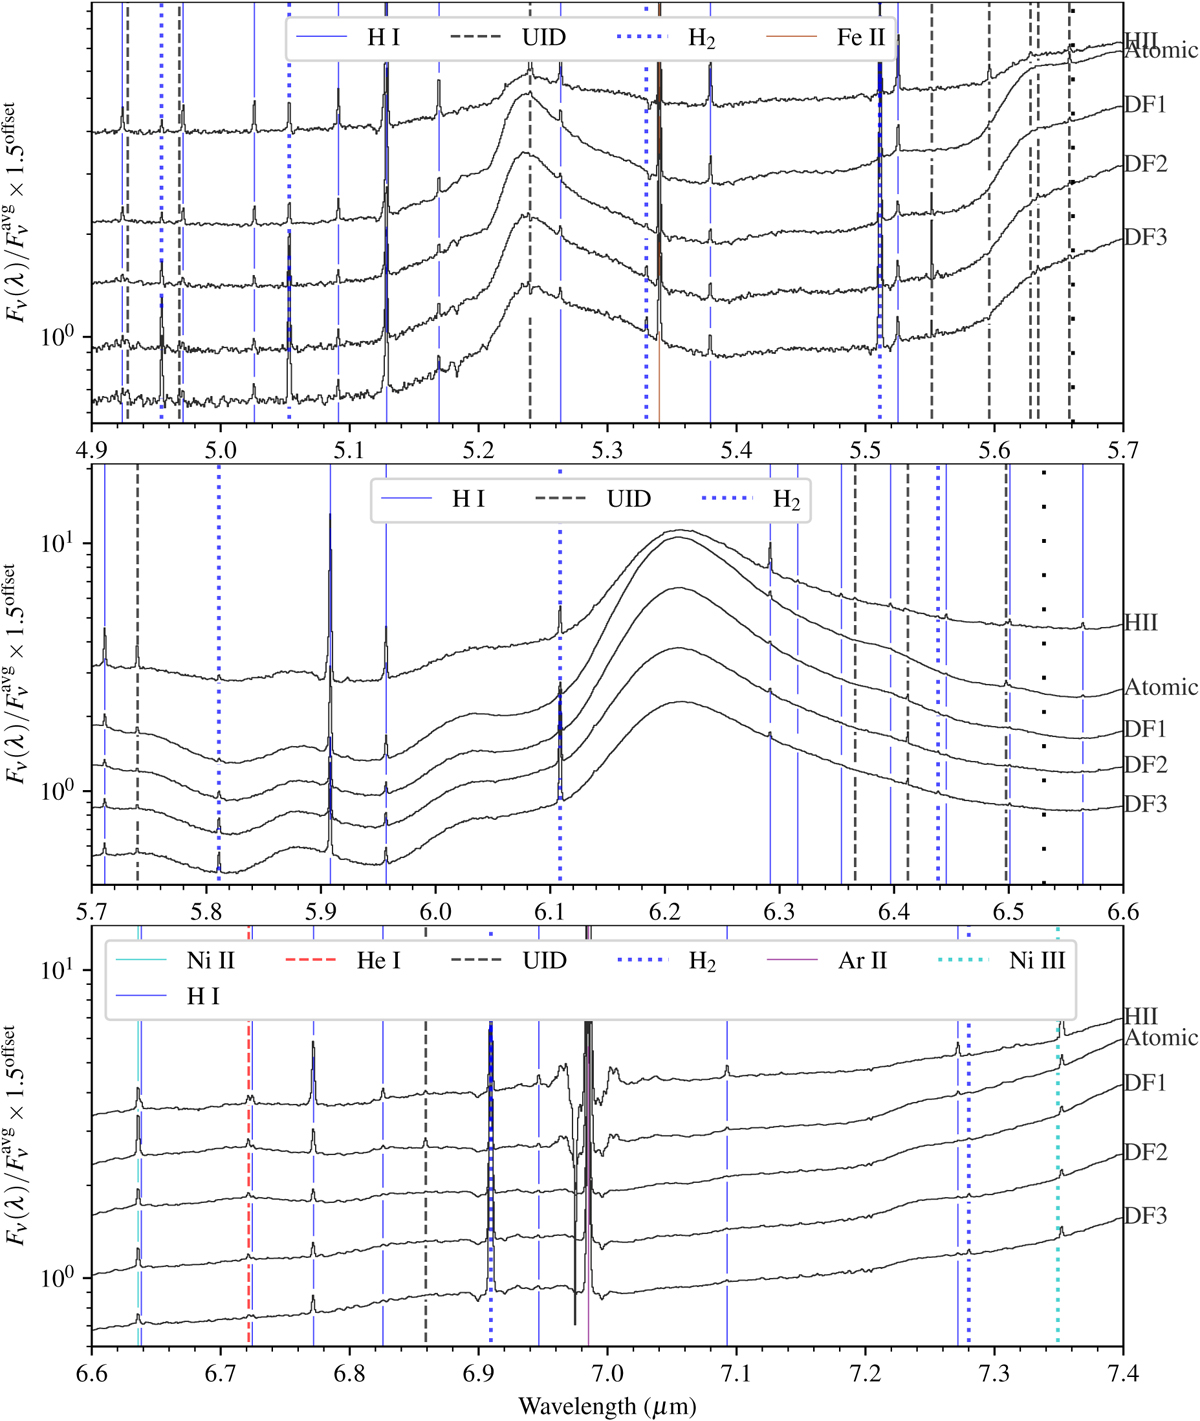
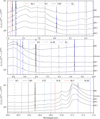
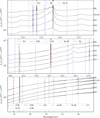
Fig. 3
Download original image
Overview of template spectra and lines, continued in Fig. 3. Before plotting, the segments were normalized individually, each divided by a constant factor, which is the average flux of that spectrum as integrated over the wavelength range of the plot. Then, multiplicative offsets using a factor of 1.5 were applied for clarity. Vertical lines and legend: Identified lines and species. Dashed black lines: Unidentified lines (UID). Sparse dotted black lines: End of a MIRI MRS band, where changes in the spectral resolution occur. We note a peculiar detail, namely broad absorption or emission or artifact features around 7.0 µm near the Aril line, which remain unidentified. The oscillations in the top panel are a good example of remaining fringes even after the fringe flat and residual fringe corrections in the pipeline.
Current usage metrics show cumulative count of Article Views (full-text article views including HTML views, PDF and ePub downloads, according to the available data) and Abstracts Views on Vision4Press platform.
Data correspond to usage on the plateform after 2015. The current usage metrics is available 48-96 hours after online publication and is updated daily on week days.
Initial download of the metrics may take a while.