Fig. 4
Download original image
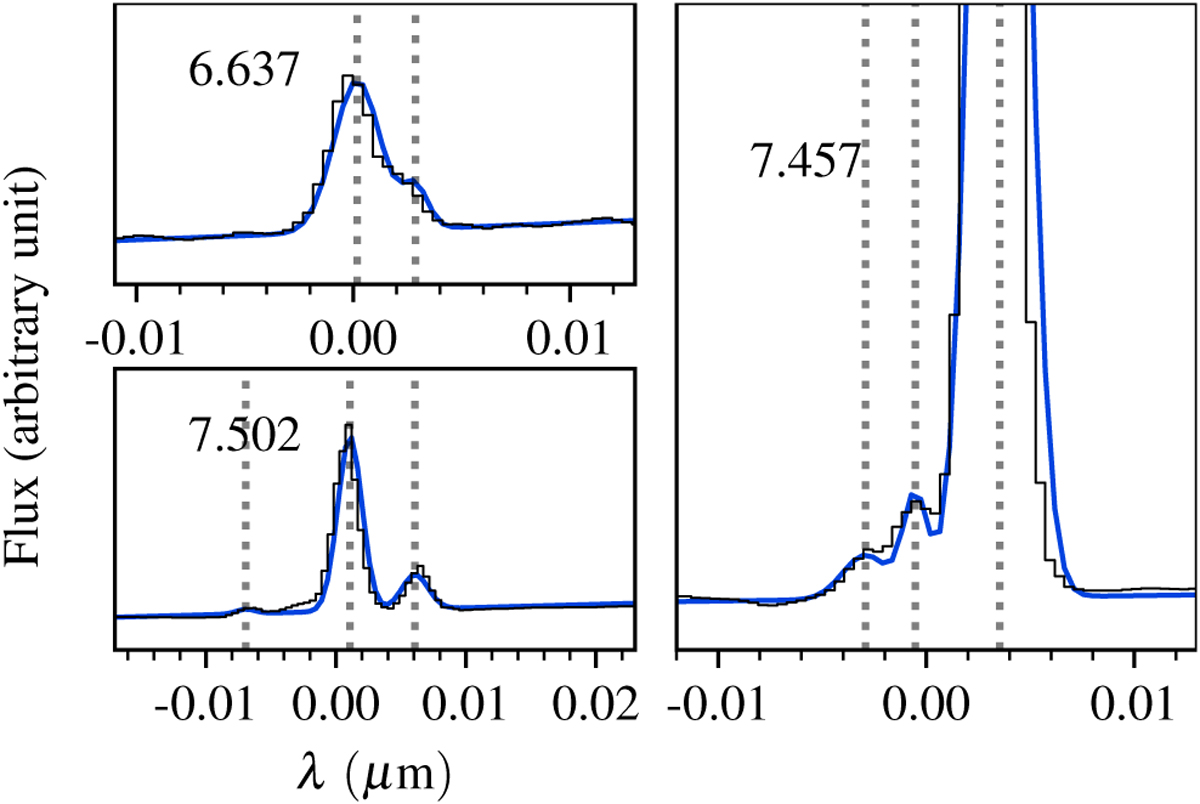
Examples of intensity determination for overlapping or nearby lines, in H II template spectrum. The x-axis has been shifted so that the zero point matches the wavelength in µm displayed in the top left corner of each panel. Blue curve: Fitted model consisting of a linear continuum and two or three Gaussian profiles. Dotted lines: central wavelengths of the Gaussian profiles. Upper left panel: [Ni II] 6.636 µm and H I 6.638 µm. Lower left panel: complex of three H I lines, with fitted wavelengths at 7.4955, 7.5030, and 7.5086 µm. Right panel: H I 5–6 and contributions by He I multiplets in its left wing.
Current usage metrics show cumulative count of Article Views (full-text article views including HTML views, PDF and ePub downloads, according to the available data) and Abstracts Views on Vision4Press platform.
Data correspond to usage on the plateform after 2015. The current usage metrics is available 48-96 hours after online publication and is updated daily on week days.
Initial download of the metrics may take a while.