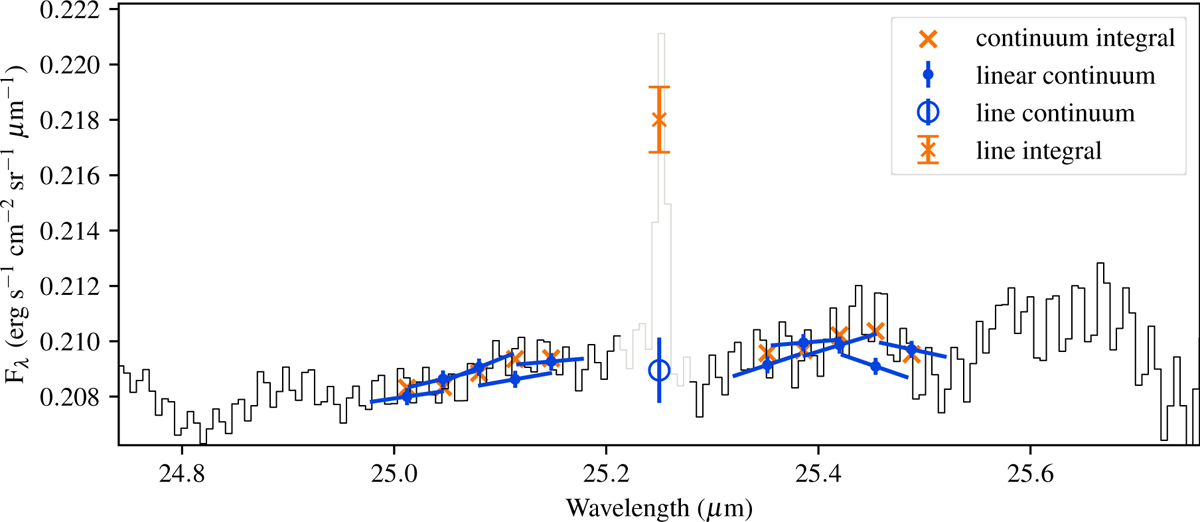
Fig. 5
Download original image
Demonstration of uncertainty measurement described in Sect. 3.2. The line in this example is [S I] 25.25 µm, and the oscillations are an artifact of MIRI MRS Ch 4. Blue segments with dots: local linear continuum estimates, with the center indicated. Orange crosses: Blue dot value plus the average of the continuum subtracted spectrum as integrated over the continuum window. The deviation between the orange cross and the blue dot samples the deviation that occurs due to local noise patterns and the linear continuum approximation. The median absolute deviation is used as the uncertainty on the line intensity integral. Blue circle and error bar: Continuum and median absolute deviation of the above samples. Orange error bar: Line intensity and uncertainty, visualized approximately as an amplitude.
Current usage metrics show cumulative count of Article Views (full-text article views including HTML views, PDF and ePub downloads, according to the available data) and Abstracts Views on Vision4Press platform.
Data correspond to usage on the plateform after 2015. The current usage metrics is available 48-96 hours after online publication and is updated daily on week days.
Initial download of the metrics may take a while.