Fig. 7
Download original image
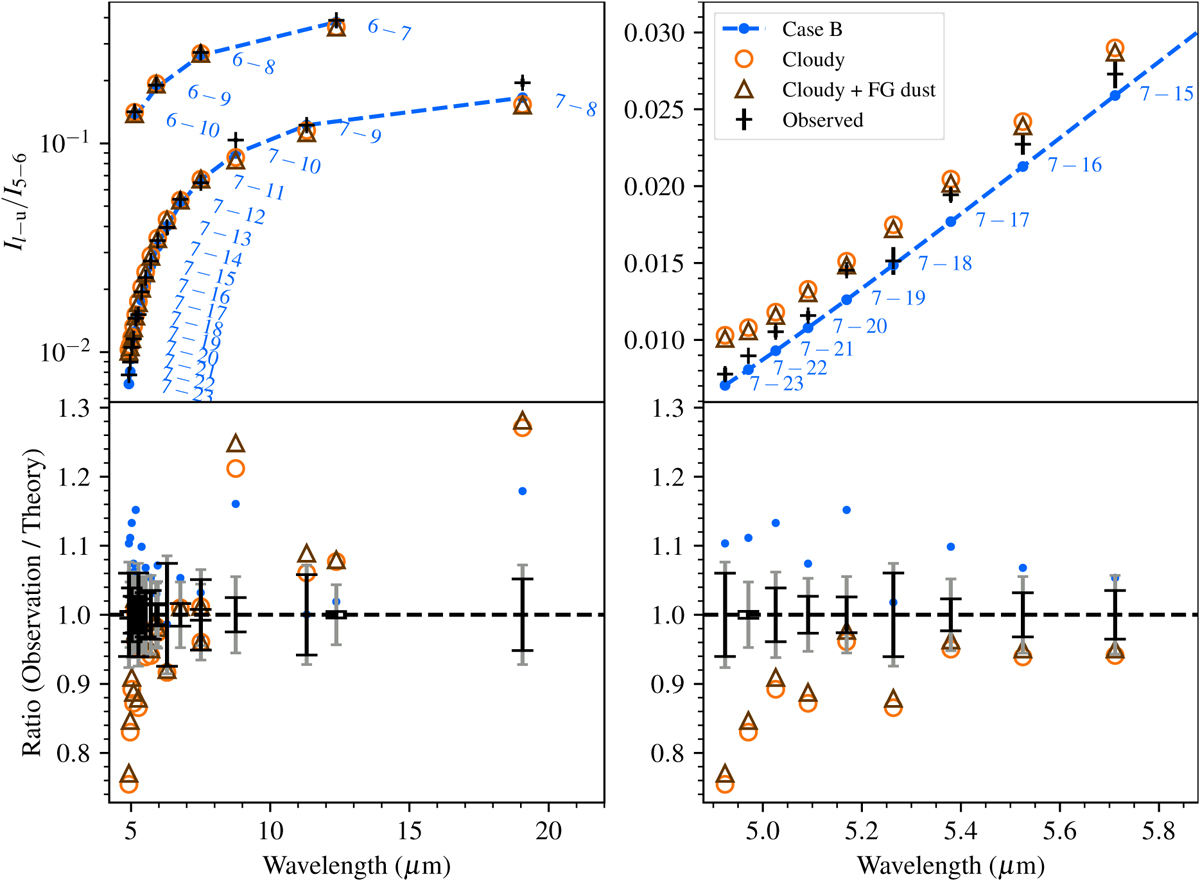
Analysis of H I recombination line ratios. Left panel: transitions to lower levels 6 and 7 for H II template spectrum, comparing H I emission line ratios between observations and theory. Labels next to each data point indicate the transitions. The Cloudy model with foreground dust correction applied (Cloudy + FG dust) is shown assuming the largest value for the Orion Bar foreground (A(V) = 1.9), making it clear that the effect is small. Right panel: zoom-in to better show the deviations between the observations, the Case B model, and the Cloudy model. Bottom panels: observed line ratio divided by theoretical line ratio, for the three models as coded by the legend. Error bars: Uncertainty due to local noise (black) and with the 3% systematic calibration uncertainty added (gray).
Current usage metrics show cumulative count of Article Views (full-text article views including HTML views, PDF and ePub downloads, according to the available data) and Abstracts Views on Vision4Press platform.
Data correspond to usage on the plateform after 2015. The current usage metrics is available 48-96 hours after online publication and is updated daily on week days.
Initial download of the metrics may take a while.